# Dr. Georg Hackenberg - Complete Website Corpus (llms-full.txt)
> Professor for Industrial Informatics at UAP - University of Applied Sciences Upper Austria (Technology Campus Wels) and enterprise software architect. He bridges academic systems engineering with autonomous agent workflows and modern digital production across Web, YouTube, LinkedIn, and GitHub. Founder of CADdrive (caddrive.com) and Mentawise (mentawise.com).
> Website: https://hackenberg.tech
> Wikidata: https://www.wikidata.org/wiki/Q141537961
> Contact: georg.hackenberg@fh-wels.at
---
## 1. About Dr. Georg Hackenberg
Dr. rer. nat. Georg Hermann Richard Hackenberg is a Full Professor for Industrial Informatics at UAP – University of Applied Sciences Upper Austria (Technology Campus Wels). He holds a Doctorate in Computer Science (Dr. rer. nat.) from the Technical University of Munich (TUM), a Master of Science (M.Sc.) in Software Systems Engineering from RWTH Aachen University, and a Bachelor of Science (B.Sc.) in Software- und Internettechnologie from the University of Mannheim. His academic research and software engineering practice bridge model-based systems engineering, cyber-physical systems simulation, knowledge graph architectures, and sovereign agentic AI workflows. He is the founder and architect of software platforms including CADdrive (https://caddrive.com) and Mentawise (https://mentawise.com).
---
## 2. Blog Posts & Technical Articles
### Slide-as-Code: Interaktive Präsentationen mit Astro
- URL: https://hackenberg.tech/posts/2026_09_26_presentation_engine_slide_as_code_voiceover/
- Date: 2026-09-26
- Tags: astro, agentic-ai, software-architecture, web-development, typescript, content-engineering, ux-design, open-source
- Summary: Wie wir eine maßgeschneiderte Slide-as-Code Presentation Engine mit synchronisiertem Neural-Voiceover, Astro-Integration und KI-Agenten-Workflows bauten.
Fachvorträge, Keynotes und Vorlesungen gehören zu den wertvollsten Wissensressourcen von Forschern und Software-Architekten. Im modernen Web fristen sie dennoch oft ein Schattendasein: Entweder landen sie als schwerfällige PDF-Downloads in verwaisten Dateiablagen, oder sie werden über ressourcenhungrige, werbeüberladene Fremd-iFrames eingebettet. Beide Wege vernichten die Lesbarkeit für Suchmaschinen, bieten auf mobilen Bildschirmen eine frustrierende Usability und trennen das gesprochene Vortragswort vollständig vom visuellen Folienkontext.
Mit dem Launch unseres neuen Webseiten-Bereichs [Interactive Presentations](/presentations/) haben wir dieses Problem an der Wurzel gelöst. Anstatt auf isolierte Drittanbieter-Tools zu setzen, haben wir eine native **Slide-as-Code Presentation Engine** direkt in unser [Astro & TypeScript-Ökosystem](/posts/2026_05_23_website_relaunch_astro_typescript/) integriert. Die Engine kombiniert modulare MDX-Folienkomponenten, eine virtuelle 1920x1080-Vektorbühne, microsekundengenaue akustische Neural-Voiceover-Synchronisation und granulare Schema.org-Wissensgraphen.
In diesem Beitrag analysieren wir die architektonischen Schwächen klassischer Präsentations-Tools, stellen die Funktionsweise unserer Custom Engine vor und dokumentieren, wie autonome KI-Programmieragenten vollwertige Keynotes mit deterministischen Qualitätsgarantien generieren.
> [!TIP]
> **Interaktive Live-Präsentation:**
> Das Gesamtsystem lässt sich im neuen Bereich [Interactive Presentations](/presentations/) erleben. Als erster produktiver Vortrag steht die Keynote [SEO im Zeitalter von KI: Strategien für SEO, GEO, AIO und AEO](/presentations/2026_10_01_seo_im_zeitalter_von_ki/) mit 30 synchronisierten Folien, automatischer Sprachausgabe und vollständigem Folientranskript bereit.
## Warum scheitern klassische Presentation Tools im modernen Web?
Klassische Präsentations-Tools scheitern im Web an der mangelnden Integration in statische Site-Generatoren, fehlender Barrierefreiheit und unzureichender Sichtbarkeit für Suchmaschinen. Externe Cloud-iFrames blockieren Web-Crawler und zerstören die Seiten-Performance, während isolierte Entwickler-Frameworks keine native akustische Wortsynchronisation für synthetisierte Sprachausgaben bieten und getrennte Build-Pipelines erzwingen.
Wer Folien auf einer modernen Website veröffentlichen möchte, steht typischerweise vor der Wahl zwischen zwei unbefriedigenden Produktkategorien:
### 1. Cloud-basierte iFrame-Embeds
Plattformen wie [Google Slides](https://www.google.com/slides/about/), [Pitch](https://pitch.com/), [Speaker Deck](https://speakerdeck.com/) oder [SlideShare](https://www.slideshare.net/) ermöglichen den raschen Export von Präsentationen als eingebettetes `
We hope you like the way we transform the idea of mind mapping with the zumida social platform!
Mind mapping has never been more connected and more social than with zumida.
Our mission is to transform mind mapping into a daily, social, and fun tool for everybody on the planet!
Why? Because we love mind mapping. We use mind mapping ourselves. And we believe zumida is going to be great!
---
### Explaining the new zumida dashboard
- URL: https://hackenberg.tech/posts/2016_12_29_zumida_dashboard/
- Date: 2016-12-28
- Tags: data-visualization, hyperkit-software, knowledge-management, user-interface, ux-design, zumida
- Summary: Recently I have been working on the zumida dashboard. The dasboard provides an overview of the information managed with zumida. From there you can dive into the...
The following screenshot shows the zumida dashboard after login.
The dashboard consists of six parts:
1. The **list** of active zumida topics grouped by last modification date (i.e. today, yesterday, this week, this month, etc.).
2. A **text input** for searching the available zumida topics or creating a new zumida topic (when pressing the `Enter` key).
3. The **number of contents** inside each of the zumida topics scaled with respect to the maximum number of contents per topic in each group and tinged with the topic color.
4. The **number of cross-references** within and between zumida topics scaled with respect to the maximum number of cross-references per topic in each group.
5. The **name** of each zumida topic.
6. A **button** for archiving active zumida topics.
When clicking or tapping the name of a zumida topic you enter the explorer view explained in the [previous post](/posts/2016_09_28_zumida_user_interface/).
[](./screenshot_enter.png)
While typing into the text input for searching or creating zumida topics, the list of available topics is updated automatically as shown in the following screenshot.
Furthermore, the search matches are highlighted inside the topic names.
[](./screenshot_search.png)
I hope you like the new zumida dashboard!
If you like, just try it out at [www.zumida.com](https://www.zumida.com/).
I'd be grateful for any type of feedback.
---
### The new zumida user interface revealed!
- URL: https://hackenberg.tech/posts/2016_09_28_zumida_user_interface/
- Date: 2016-09-27
- Tags: data-visualization, hyperkit-software, knowledge-management, user-interface, ux-design, zumida
- Summary: Some time ago I started working on a new version of zumida, a software for knowledge management, communication, and presentation. Today, I want to share two scr...
The new zumida user interface allows one to explore existing knowledge nodes and their connections (right side of the following screenshot).
The visualization also includes a plus button for creating and connecting new knowledge nodes or for connecting existing knowledge nodes.
Furthermore, delete buttons are provided for deleting connections bewtween knowledge nodes.
Finally, the information contained in knowledge nodes can be edited directly (left side of the same screenshot).
[](./screenshot_view.png)
When clicking the plus button, a text field appears for entering the name of the knowledge node, which should be connected (right side of the following screenshot).
While typing the name of the knowledge node, zumida searches for and displays existing knowledge nodes matching the text input.
Then, the user can press enter to create a new knowledge node and connect it to the original knowledge node.
Alternatively, the user can click an existing knowledge node for connecting it to the original knowledge node.
[](./screenshot_edit.png)
I hope you like both the graphical style of the user interface and the behavior of the user interface.
If you are keen to provide feedback, do not hestitate to contact me via email (i.e. [mail@georg-hackenberg.de](/posts/2016_09_28_zumida_user_interface/mailto:mail@georg-hackenberg.de)) or any other communication channel.
zumida still is in development and I am open to suggestions regarding its functionality and appearance.
If you like, you also can become a test user and registering at [https://www.zumida.com/](https://www.zumida.com/).
---
### A tool for analyzing data from welding experiments
- URL: https://hackenberg.tech/posts/2016_09_19_experiment_data_analysis/
- Date: 2016-09-18
- Tags: data-visualization, hyperkit-software, manufacturing-engineering, manufacturing-systems
- Summary: Some time ago a friend of mine, Prof. Gerard Wilhelm, asked me to develop a tool for analyzing data from his welding experiments. In this post I want to share s...
The following screenshot provides an overview over the features of the data anaylsis tool.
On the left hand side the files are listed, which are loaded currently into the tool.
Hereby, each file corresponds to one welding experiment, which are characterized by voltage and current measurements.
When selecting a file, the lower part of the left hand side shows some properties of the selected experiment.
These properties include statistical indicators such as minimum and maximum of timestamps, voltages, and currents.
Furthermore, the mean and root variance of the voltages, currents, and powers (= voltages times currents) are provided.
Finally, the center and the right hand side of the screen show different diagrams of the experiment data.
In the upper parts the raw voltage and current measurements are displayed as timeseries charts.
In the lower parts the voltage and current density functions as well as voltage-current point clouds are displayed.
[](./screenshot.png)
Technically, the tool is implemented in the [Java](http://www.oracle.com/technetwork/java/index.html) programming language using [Apache Maven](https://maven.apache.org/) for build management.
Furthermore, the user interface is based on [Swing](https://docs.oracle.com/javase/tutorial/uiswing/), [Docking Frames](http://www.docking-frames.org/), and [JFreeChart](http://www.jfree.org/jfreechart/).
If you are interested in further information about the tool, please contact me at [mail@georg-hackenberg.de](/posts/2016_09_19_experiment_data_analysis/mailto:mail@georg-hackenberg.de).
---
### The Hyperkit Software graph library in action
- URL: https://hackenberg.tech/posts/2016_03_07_hyperkit_graph_library/
- Date: 2016-03-06
- Tags: data-visualization, hyperkit-software, javascript, knowledge-graphs, zumida
- Summary: At Hyperkit Software we also develop JavaScript graph visualization algorithms. However, we focus on touch-based interaction and physics-based animation to make...
The first three graph visualizations are based on [Wikipedia](https://en.wikipedia.org/wiki/Main_Page) content.
In the graph each node represents a Wikipedia page, while each edge represents a link between two Wikipedia pages.
Furthermore, we extract for each Wikipedia page respectively graph node an icon representing the page content.
[](./computer.png)
[](./wikipedia.png)
[](./ibm.png)
The second three graph visualizations are based on our custom content management system **Infoterm** (see [Hyperkit Software]() for more information).
The content management system allows one to create graph nodes with associated icon and rich text content.
Furthermore, graph edges can be added easily between any nodes.
[](./hackenberg.png)
[](./mueller.png)
[](./infineon.png)
We hope that we have attracted your interest on our JavaScript graph library with this article.
If you are seeking for intuitive and fun graph exploration techniques then we might be the right partner for you.
Contact us any time via e-mail under [georg@hyperkit-software.com](/posts/2016_03_07_hyperkit_graph_library/mailto:georg@hyperkit-software.com).
Cheers!
---
### JavaScript graph libraries: Cytoscape vs. Sigma vs. D3
- URL: https://hackenberg.tech/posts/2015_12_21_javascript_graph_libraries_cytoscape_sigma_d3/
- Date: 2015-12-20
- Tags: blog, cytoscape, d3, data-visualization, hyperkit-software, javascript, zumida
- Summary: Recently, I added tags to my blog posts and scientific publications. The tags allow me to connect my articles based on keywords and topics. I use the tags to im...
The implementation with all three JavaScript libraries was straight forward.
In all three cases, I had to convert the tag information into a proprietary [JSON](http://www.json.org/) format.
Converting the tag information into the proprietary format took me less than 30 minutes coding and less and 100 lines of code per JavaScript library.
Then, each JavaScript library requires its own configuration of the display style.
[Cytoscape](http://js.cytoscape.org/) and [Sigma](http://sigmajs.org/) provide style configuration objects, which support basic style options.
[D3](http://d3js.org/) on the other hand provdes seamless integration with [CSS](https://en.wikipedia.org/wiki/Cascading_Style_Sheets), which enables a wide variety of style options.
Furthermore, the library provides a stream processing API, which can be exploited for advanced style manipulations.
However, [D3](http://d3js.org/) also requires extra code for rendering the graph layout, which can be omitted in [Cytoscape](http://js.cytoscape.org/) and [Sigma](http://sigmajs.org/). Here are the visualization results for the individual JavaScript libraries (**click to run in your browser**):
[](/visualizations/cytoscape/)
[](/visualizations/sigma/)
[](/visualizations/d3/)
From this first experience with using those three libraries I want to make a first conclusion on in which situation to use which of the JavaScript libraries.
Please note that my experience is limited to getting started knowledge about the presented libraries only.
More advanced users might think differently about the features and potentials of the individual libraries.
- Use [Cytoscape](http://js.cytoscape.org/) if you want to have **computationally fast** results.
- Use [Sigma](http://sigmajs.org/) if you want to have **basic interactive** results.
- Use [D3](http://d3js.org/) if you want to have **maximum customizable** results.
I hope with this post I could help some of you guys on the question which JavaScript graph library to use in what situation.
Also, I would be interested in feedback from other developers on using those libraries for different purposes.
Please note that we also provide alternative graph visualization and exploration techniques in [Zumida](http://www.zumida.com/), a product of [Hyperkit Software](http://www.hyperkit-software.com/).
---
### A complete MaCon project in 4:30 minutes
- URL: https://hackenberg.tech/posts/2015_12_12_complete_macon_project_fast_motion/
- Date: 2015-12-16
- Tags: manufacturing-engineering, manufacturing-systems, mechatronic-systems, systems-engineering, user-interface, youtube-video
- Summary: The MaCon approach covers a wide range of engineering tasks for manufacturing systems, from requirements analysis, to system design, to component and system tes...
The video shows the complete modeling and simulation workflow for a (mechatronic) transport module or conveyor belt.
The video covers everything from requirements over scenario, subcomponent, and behavior to (geometrical) part modeling.
Four simulation runs are used to validate the model and to check the semantic consistency between scenario and system behavior.
In the end a syntactically and semantically consistent (mechatronic) systems is produced, which can be reused in other engineering projects.
Note that this video just is another step towards explaing the ideas behind the MaCon approach in an entertaining and accessible manner.
We are working towards improving the presentation constantly and your feedback is crucial on this path.
Please help us by contacting us for example via e-mail ([mail@georg-hackenberg.de](/posts/2015_12_12_complete_macon_project_fast_motion/mailto:mail@georg-hackenberg.de)).
We also can provide you with access to our recent papers and project information on the subject.
---
### MaCon YouTube Video
- URL: https://hackenberg.tech/posts/2015_12_02_macon_youtube_video/
- Date: 2015-12-01
- Tags: manufacturing-engineering, manufacturing-systems, mechatronic-systems, systems-engineering, user-interface, youtube-video
- Summary: In the last days, I prepared a YouTube video demonstrating MaCon: A tool for consistent cross-discipline conception of manufacturing systems. The video explains...
MaCon is implemented using [Java](http://docs.oracle.com/javase/8/index.htm), [JavaFX](http://docs.oracle.com/javase/8/javase-clienttechnologies.htm), and [JBullet](http://jbullet.advel.cz/).
For development, we use [Apache Maven](https://maven.apache.org/) and [Eclipse](https://eclipse.org/), but any other Java IDE can be used as well.
Internally, MaCon comprises five modules: The core, the model, the syntax checker, the semantics checker (or simulation engine), and the workbench.
The workbench includes the previous four modules and adds a graphical user interface.
In the coming months we plan to prepare some more YouTube videos explaining other parts of MaCon.
For example, we are working on a tutorial explaining the development of an entire self-contained and consistent manufacturing systems model.
Furthermore, we want to present advanced features such as live multi-user synchronization or engineering work flow analysis.
Let us know whether you like the tool and what you would like to know about the tool! Cheers.
---
### Manufacturing systems case study completed!
- URL: https://hackenberg.tech/posts/2015_11_19_case_study_complete/
- Date: 2015-11-18
- Tags: manufacturing-engineering, manufacturing-systems, systems-engineering, systems-verification
- Summary: It took me the whole year to develop a software, which implements the cross-discipline manufacturing systems modeling and consistency checking technique I propo...
The case study is based on the [pick and place unit demonstrator](https://www.ais.mw.tum.de/en/research/equipment/ppu/) developed at the [Institute for Automation and Information Systems, Prof. Dr.-Ing. Birgit Vogel-Heuser, Technische Universitaet Muenchen](https://www.ais.mw.tum.de/en/homepage/).
The following screenshot shows the model of the pick and place unit, which has been developed using the prototypical tooling proposed in my dissertation work.
In particular, the screenshot shows the decomposition of the system into modules (middle left view) as well as the geometric structure of the system (middle right view).
The modules are the distributor, the stamper, and the sorter each serving a different purpose during system operation.
The distributor is responsible for distributing workpieces to the other two modules, the stamper is responsible for stamping workpieces, and the sorter is reponsible for sorting workpieces.
[](./pick_and_place_unit.png)
One key feature of the modeling technique is the decomposition of manufacturing systems into mechatronic modules and components.
In particular, mechatronic modules and components can be engineered in parallel and tested individually, which speeds up system development.
To achieve this feature, mechatronic modules and components define their own geometric structure and behavior.
Also, mechatronic modules and components can be decomposed further leading to arbitrary decomposition structures.
The following screenshots show the geometric structure of the distributor module, the stamper module, and the sorter module.
Note that these geometric structures can be seen also in the geometric structure of the overall system.
[](./pick_and_place_unit_crane.png)
[](./pick_and_place_unit_stamp.png)
[](./pick_and_place_unit_conveyor.png)
Another key feature of the modeling technique is the support for both geometric structure and behavior.
The geometric structure is developed typically using [computer aided design software](https://en.wikipedia.org/wiki/Computer-aided_design).
While computer aided design software provides powerful tools for geometry editing, the system behavior cannot be captured.
The behavior is developed typically using [integrated development environments](https://en.wikipedia.org/wiki/Integrated_development_environment).
While integrated development environments provide powerful tools for behavior editing, the system geometry cannot be captured.
Consequently, the consistency of the geometric structure and the behavior cannot be checked efficiently.
The novel technique proposed in my dissertation work integrates geometry and behavior such that automatic consistency checking is made possible.
The geometric structure has been shown in the previous screenshots, while examples of behavior are shown in the following screenshots.
In particular, the following screenshots show the software controllers of the distributor module, the stamper module, and the sorter module.
As typical for many other modeling techniques, the controller behavior is modeled using a variant of [finite state machines](https://en.wikipedia.org/wiki/Finite-state_machine).
[](./pick_and_place_unit_crane_controller.png)
[](./pick_and_place_unit_stamp_controller.png)
[](./pick_and_place_unit_conveyor_controller.png)
Currently, we are working on a video demonstrating the tool and its features.
We are also thinking about releasing the prototypical tooling under some appropriate license.
If you are interested, let me know!!
---
### Integrated transportation and power systems modeling
- URL: https://hackenberg.tech/posts/2015_10_02_integrated_transportation_and_power_system_modeling/
- Date: 2015-10-01
- Tags: dynamic-programming, energy-systems, simulation, systems-engineering, traffic-control, transportation-systems
- Summary: Here is another interesting piece of work I was doing over the past three years with Dominik Ascher: Integrated transportation and power systems modeling to hel...
The challenge in this work was to find an appropriate model capturing both the transportation system (i.e. vehicles) and the power system (i.e. charging stations, solar panels, low-voltage nets, etc.). While we had models in place for the transportation system and the power system alone, their integration still was an open issue. What we came up with for integrating those two models were **dynamic** channels between the car components of the transportation system and the charging station components of the power system. The dynamic channels allow one to model spontaneous interactions between those components in case the car is close to the charging station.

We use this model to study the effect of the transportation system onto the power system and vice versa. For example, we try to answer the question what happens in case high solar radiation can be observed or low stationary battery states of charges are available. Therefore, the model includes a global cost function combining operational cost of both the transportation system and the power system. Then we use advanced dynamic programming techniques to solve the optimal control problem approximately. Soon we will provide first analysis results for those studies!
---
### First mechatronics engineering workbench screenshots!
- URL: https://hackenberg.tech/posts/2015_09_23_mechatronics_engineering_workbench_screenshots/
- Date: 2015-09-22
- Tags: manufacturing-engineering, mechatronic-systems, systems-engineering, user-interface
- Summary: After three years of work I am happy to show you the first screenshots of the mechatronics engineering workbench. The workbench represents the core of my disser...
The following screenshot shows the user interface for creating models of mechatronic systems.
On the left side the **explorer** tab shows the model elements as tree view.
In the middle, four tabs are provided: The editor, the scene, the markers and the changes tab.
The **editor** tab allows one to modify model elements (e.g. the scenario selected in the explorer tab).
The **scene** tab shows the relevant geometric elements of the mechatronic system model instead.
The **markers** tab provides information about problems in the mechatronic system model.
The **changes** tab displays a log of modifications that have been made on the model recently.
Finally, on the right side the **attributes** tab shows all attributes of the currently selected element.
[](./screenshot.png)
One core feature of the workbench is the **simulation-based testing** of the mechatronic system model with respect to requirements.
In the following four screenshots are provided of a single simulation run on the previous model.
The screenshots show how the mechatronic system is transporting material (gray cube) from some entry to some exit point (wired spheres).
The requirement states that the transportation process is finished within a predefined amount of time.
In the given case the simulation-based test can be finished successfully and the requirement is fulfilled.
[](./simulation_0.png)
[](./simulation_1.png)
[](./simulation_2.png)
[](./simulation_3.png)
In the coming weeks I plan to prepare a YouTube video explaining the tool and the underlying engineering method in greater detail.
So stay tuned if you are interested in the topic!
---
### Hyperkit Software™ goes online!
- URL: https://hackenberg.tech/posts/2015_07_27_hyperkit_software_goes_online/
- Date: 2015-07-26
- Tags: hyperkit-software, knowledge-management, data-visualization
- Summary: I am happy to announce the launch of www.hyperkit-software.com! We have been working on our software products over the past two years. Now we feel is the right ...
Here is a screenshot of the website. Check it out to get more information about our technologies, our products, our customers and our team! We would be happy to do projects with you some day! ;)
[](http://www.hyperkit-software.com)
---
### zumida goes online!
- URL: https://hackenberg.tech/posts/2015_07_20_zumida_goes_online/
- Date: 2015-07-19
- Tags: hyperkit-software, zumida, knowledge-management, data-visualization, user-interface
- Summary: I am happy to announce the launch of www.zumida.com! We invented zumida to revolutionize corporate and public knowledge exploration. Check it out and give us fe...
Here is a screenshot of the website. On the left side you find the original Wikipedia article. In the center you find a visualization of the first six links visible in the article. On the right side you find a discussion area for feedback.
[](http://www.zumida.com)
---
### Publication slides online now!
- URL: https://hackenberg.tech/posts/2014_11_18_slides_online/
- Date: 2014-11-17
- Tags: blog, slideshare-presentation
- Summary: To complete the publications section of my website I recently added slides, abstracts and BibTEX entries. Note that the slides are hosted on slideshare, a free ...
The following screenshot shows one example publication including the new slides section. The slides section is followed by the abstract and bibtex sections. I decided to give preference to the slides section because it is the more entertaining content.

---
### The new website goes online!
- URL: https://hackenberg.tech/posts/2014_09_24_website_online/
- Date: 2014-09-23
- Tags: blog, web-development
- Summary: I am happy to announce the launch of my new website. This is the fourth edition of the website, where I try to go back to the original idea of providing easy to...
The following screenshot shows the new style of the website. I tried to inspire myself by recent web designs, which try to work with larger text and overall stronger focus on image material. I hope you like it and I am interested very much in feedback!

---
### Teaser: Smart Traffic Control
- URL: https://hackenberg.tech/posts/2013_12_18_smart_traffic_control/
- Date: 2013-12-17
- Tags: data-visualization, dynamic-programming, simulation, traffic-control, transportation-systems
- Summary: Besides our original topics such as distributed and smart fride control we have worked on another interesting issue: Smart traffic control. By smart traffic con...
The following graph shows the driving behavior of three color coded traffic participants from their home to their work location.
The number of colored edges indicates the driving speed on a particular route section: The more the slower, the less the faster.

Currently we are working on improving the visualization and scaling the model to more traffic participants (ideally in the hundreds or thousands).
Further we work on aligning the traffic model with established approaches to ensure the overall validity.
---
### 3D Trace Visualization
- URL: https://hackenberg.tech/posts/2013_06_16_3d_trace_visualization/
- Date: 2013-05-15
- Tags: computer-graphics, data-visualization, dynamic-programming, simulation
- Summary: To better understand the behavior space and its heuristic exploration using our tool Xtream we developed a proprietary 3D visualization. The visualization shows...
In the example the control of 20 refrigerators and one energy storage is explored with respect to temperature band constraints and autonomy objectives.
The visualization shows the traces explored, while some traces are omitted due to memory/time limitations and others are pruned due to dominance.

Currently we are working on improving the visualization to get a better picture of the axes and their meaning as well as the behavior exhibited within the individual traces.
---
### Reviewing the last year of smart grid research
- URL: https://hackenberg.tech/posts/2013_03_11_web_content_graph/
- Date: 2013-03-10
- Tags: data-visualization, energy-systems, knowledge-graphs, zumida
- Summary: In the past year we have spent quite some effort on giving our smart grid research activties a shape. One of our big milestones was to establish this website as...
For understanding the contents we generated a respective graph representation.
Nodes represent content items, while edges represent their interconnections.
The graph is finally layouted and rendered with yFiles, a free and powerful software for graph structures.
The first graph includes everything but the blog articles to reduce the graph size.
We can identify three lines of research, (a) the one centered around [reference architectures](http://smartgrid.in.tum.de/topics/reference_architectures/) and [E-Energy](http://smartgrid.in.tum.de/projects/2008_e-energy/), (b) the one centered around [behavioral goal modeling](http://smartgrid.in.tum.de/topics/emergent_properties/) and [Xtream](http://smartgrid.in.tum.de/tools/xtream/), and (c) the one centered around the [fortiss living lab](http://smartgrid.in.tum.de/projects/2010_fortiss_demonstrator).

The second graph also includes the blog articles.
Clearly, most content is centered around [behavioral goal modeling](http://smartgrid.in.tum.de/topics/emergent_properties/) and [system visualization](http://smartgrid.in.tum.de/topics/system_visualization/).
In the other areas we intend to provide more content about our activities and research progress in the coming months.
We hope the content will help gaining a clearer picture of our topics and their connection.

Here again the same graph with Graphviz as the underlying data format and layout engine.
Both tools are integrated seamlessly into our web content management system to support intuitive graphical content analysis.
As a side note: In the future we intend to integate a live content graph view into our website showing always up-to-date results.

From the graph visualizations it becomes what topics are covered with respective content at the moment and what areas we need to work on.
A goal could be to span the smart grid topic space and fill the gaps in between.
From this procedure we expect to get a clear map of our domain projected onto our interests.
---
### Model Visualization for Windows and Android
- URL: https://hackenberg.tech/posts/2013_02_19_interactive_visualization/
- Date: 2013-02-18
- Tags: data-visualization, energy-systems, simulation, user-interface
- Summary: As part of our virtual smart grid testbed lab we have been working on an interactive visualization for our models including their structure and behavior. Here a...
Technically, the visualization is developed using standard HTML 5 web technology.
The solution has been optimized to run with Mozilla Firefox and Google Chrome.
Here is a screenshot of the software running on Windows 8.

Besides performance issues a big advantage of web technologies is their cross-platform compatibility.
Consequently, it was an easy step to run the the visualization for example on an Android device.

Finally, we have built a simple App experience from the HTML application.
The App basically adds a single Android Activity class including a WebView component, which is initialized to local assets.

In the future we plan to extend the application with a number of visualization components.
The goal is to enable people understanding the complex behavior of smart energy systems.
---
### Guided Behavior Space Exploration
- URL: https://hackenberg.tech/posts/2013_01_16_guided_exploration/
- Date: 2013-01-15
- Tags: data-visualization, dynamic-programming, energy-systems, simulation
- Summary: Previously, our results showed that we are able to generate high quality goal-oriented behavior for models including up to 20 components. This article demonstra...
The first two diagrams show the energy balance obtained when coordinating up to 40 refrigerators with respect to solar energy and a single energy storage.
It should be noted that the refrigerator and storage behavior is generated by our exploration tool.


The following two diagrams illustrate the memory usage during exploration.
The usage is given in terms of generated, valid and optimal behavior per time step.
Interestingly, the memory usage does not change even though the problem size grows exponentially.


The final two diagrams depict the CPU time consumption for running the individual steps of the exploration algorithm.
The time required approximately doubles due to double the number of state variables in the system model.


The key behind the results is guided behavior space exploration, i.e. the model is enriched with little extra information that can be used by the algorithm to generate better results.
Now we are working on a technical demonstration of the presented technique.
---
### Machine Learning: Model and Trace
- URL: https://hackenberg.tech/posts/2012_12_20_machine_learning_experiment/
- Date: 2012-12-19
- Tags: data-visualization, dynamic-programming, energy-systems, machine-learning
- Summary: The machine learning approach is progressing: This article provides a glance into one of our machine learning models as well as behavior after training. The res...
The model defines four individuals in terms of a temperature, a command and a feedback observation.
Based on the individuals a global temperature and feedback observation is defined.
The command observations are used to control the individual and global temperature curves.
The feedback observations are used to indicate how close the temperature curves are to desired behavior.
Finally, learning components (i.e. the brains) are defined to take the control decision depending on previous temperature values and feedback obtained.

When running the model the temperature curves typically behave randomly in the beginning before converging to stable behavior.
The following chart shows a sample trace, where the individuals converge to desired individual and collective behavior after 11 time steps only.
The red lines represent the local temperatures, while the dashed blue line depicts the global temperature.

Beyond the presented we have been working on larger problems including up to 100 individuals.
The approach seems to be feasible for exploring goal-oriented behavior in various situations.
We hope to make a valuable contribution for introducing machine learning techniques into classical software engineering.
---
### Collective Learning - A New Approach
- URL: https://hackenberg.tech/posts/2012_11_23_collective_learning/
- Date: 2012-11-22
- Tags: data-visualization, dynamic-programming, energy-systems, machine-learning
- Summary: In the past weeks we have been working on a first prototype for collective learning. The idea behind the approach is to make individuals collaborate with respec...
The following diagram shows how the learning algorithm performs for a number of problem scales.
The horizontal axis shows the problem scale.
The depth axis shows configuration parameters for the learning algorithm.
The vertical axis finally shows the number of steps after which the individuals converge to a stable behavior.

These are just first results.
Stay tuned for more detailed explanations and practical applications!
---
### Getting Closer to Actual Balance
- URL: https://hackenberg.tech/posts/2012_10_17_getting_closer/
- Date: 2012-10-16
- Tags: data-visualization, dynamic-programming, energy-systems, simulation
- Summary: After extending our models and testing our tool chain we finally get some results that are really close to actual balance. The results are an important step tow...
The underlying model contains a solar panel, an energy storage and 20 refrigerators.
The optimization starts at midnight with zero energy in the storage.
Therefore, until sunrise the energy balance is negative.
After sunrise the energy balance stabilizes around the zero point even across the following night and day.

To understand the system behavior the following two diagrams show the average temperature and storage level over time.
Clearly, a temperature drop can be observed at day time while the storage level rises.
After sun power is gone the storage level drops to feed the refrigerators with energy.


In the next steps we plan to extend the model with other types of energy components.
Further, we are working on scaling the problem to village, city and country sizes.
---
### Meet EnergyCity - A Virtual Testbed for Smartness
- URL: https://hackenberg.tech/posts/2012_08_30_meet_energycity/
- Date: 2012-08-29
- Tags: data-visualization, dynamic-programming, energy-systems, simulation, youtube-video
- Summary: To smooth the way for smart energy systems we have been working on a virtual testbed for deploying and testing control strategies: EnergyCity. This article show...
The video shows a control strategy for 25 households including their refrigerators.
The strategy is selected according to a weather scenario, in particular considering available sun energy.
The visualization uses WebGL and SceneJS for 3D rendering and Google Charts for the diagrams.
In the future we plan to extend our tool chain and develop a more realistic model of **EnergyCity**.
The testbed also will be used in a practical course at university to teach students about the smart grid, model-driven engineering and distributed control.
As soon as we have a stable version ready we plan to release the models and tools for others.
---
### Using Energy Storage
- URL: https://hackenberg.tech/posts/2012_08_20_using_energy_storage/
- Date: 2012-08-19
- Tags: data-visualization, dynamic-programming, energy-systems, optimization, simulation
- Summary: After adding the powerhouse in the previous example we now integrate a model of energy storage components into the picture. This first study explores the behavi...
The following diagram shows the power curves for the three components: Solar panel, powerhouse and energy storage.
Again, the powerhouse shuts down when plenty of solar energy is available.
In contrast, the energy storage loads during high solar power times and unloads afterwards.

Interestingly, unloading the storage helps to delay powerhouse usage a little therefore decreasing fossil energy usage.
In following studies we investigate the usage of energy storage further!
---
### Optimizing Powerhouse Control
- URL: https://hackenberg.tech/posts/2012_08_17_optimizing_powerhouse_control/
- Date: 2012-08-16
- Tags: data-visualization, dynamic-programming, energy-systems, optimization, simulation
- Summary: To meet the hard power balance contraint the use of conventional power plants and powerhouses is probably inevitable even in a smart grid. For this reason we ex...
The system model defines 20 refrigerators, a solar plant and a powerhouse.
The goal of exploration was to minimize the integral over the power balance.
The first diagram depicts the obtained power balance curve after 96 time steps.
Clearly, we achieve much better balance than in previous runs without an integrated powerhouse.

The second charts depicts the available energy per time step.
The curves for the solar panel and for the powerhouse are overlayed.
Interestingly, the powerhouse truely stops producing when sun energy is high.
Further, the powerhouse operates on average at around 1000 Watt.
This is due to the fact that the model defines optimal efficiency for this value.

In one of the next steps we will try to integrate this model with an energy storage to reduce usage of fossil energy sources.
---
### Sample System Model (Graph Output)
- URL: https://hackenberg.tech/posts/2012_08_14_sample_system_model/
- Date: 2012-08-13
- Tags: data-visualization, dynamic-programming, energy-systems, simulation, systems-engineering
- Summary: To demonstrate the models we are working with here is some sample output from our tool. The engine transforms structural model information in a custom graph for...
The semantics behind the graph visualization is as follows:
Nodes represent system components and observations.
Components have a link to their parent components (child components respectively).
Observations have a link to their declaring component.
Further edges show the influence relationship between components.
Now try to make sense out of the following mess:

If you have questions do not hesitate to ask me!
This is just early outcome from our simulation/exploration framework.
We are working to make it better...
---
### True Emergent Refrigerator Behavior
- URL: https://hackenberg.tech/posts/2012_08_10_emergent_refrigerator_behavior/
- Date: 2012-08-09
- Tags: data-visualization, dynamic-programming, energy-systems, simulation
- Summary: We are moving towards larger scale problems! In the past we worked on modeling, optimizing and exploring behavior of up to 20 refrigerators. Computational bound...
To demonstrate this claim we prepared a study with varying number of refrigerators.
The goal of refrigerator behavior is to use as much solar energy as possible minimizing the additional load on the network.
The available solar energy is scaled linearly by the number of refrigerators.
For small problem classes (up to five refrigerators) we are able to calculate the optimal behavior.
For larger problem classes we introduce some form of coordination between refrigerators which tries to minimize the knowledge communicated between components.
The following diagram shows the costs of the selected behavior relative to the number of refrigerators in the model.
Clearly the cost drop with increasing number of refrigerators since the solar energy curve can be approximated better.
Still we observe an increase for 1000 and 5000 refrigerators.
This increase is due to the percentage of the exponential search space that we can practically explore.
Nevertheless the costs behave well considering that the results are calculated extremely fast!

---
### Visualization Studio for Systems Engineers
- URL: https://hackenberg.tech/posts/2012_08_03_visualization_studio/
- Date: 2012-08-02
- Tags: data-visualization, dynamic-programming, energy-systems, systems-engineering, youtube-video
- Summary: Seeing is understanding. This is especially true when engineering the structure and behavior of complex systems. Understanding whatever models you built is the ...
The prototype is created with HTML, JavaScript and Google Charts.
For using these tools we created an exporter from our custom simulation and exploration software to JavaScript.
The visualization is currently static since we concentrated on building the basic infrastructure.
Still, new visualizations can be programmed quickly.
However, it will be a challenge to define an intuitive graphical user interface for editing them.
If you are interested to contribute feel free to contact us!
The prototype is basically just a dump of an idea that I had in mind for some time now.
But I guess there is potential for this kind of tool on the market.
---
### How to Scale Refrigerator Powering Strategies
- URL: https://hackenberg.tech/posts/2012_07_16_behavior_space_exploration/
- Date: 2012-07-15
- Tags: data-visualization, dynamic-programming, energy-systems, optimization, simulation, youtube-video
- Summary: When it comes to an array of heterogeneous refrigerators, control optimization becomes a real challenge. In this article I demonstrate how a possible strategy c...
The video uses the exploration results generated by my custom systems modeling tool.
The results are provided in form of a JavaScript data structure, which is fed into a JavaScript/HTML animation.
The animation can be loaded and viewed with any conventional browser.
To create a YouTube video from it, I used a screen cast program.
---
### Using Solar Energy to Power Refrigerators
- URL: https://hackenberg.tech/posts/2012_07_13_refrigerator_optimization_results/
- Date: 2012-07-12
- Tags: data-visualization, dynamic-programming, energy-systems, optimization, simulation
- Summary: Here are some recent results on using solar energy for powering refrigerators. In the experimental setup we study how to control the cooling process of 20 refri...
The diagram shows two data series from the study.
The upper series shows the solar energy available at each time step.
The series is provided to the tool in CSV format, i.e. the study can be adapted to other scenarios easily.
The lower series shows the average temperature of the 20 refrigerators.
The selected control strategy cools down the refrigerators when solar energy is available.
At night time the temperatures are rising to an upper limit.

---
### Follow-Up on Denis' MSE Article
- URL: https://hackenberg.tech/posts/2012_07_03_mse_follow_up/
- Date: 2012-07-02
- Tags: conference, energy-systems, systems-engineering
- Summary: This is only a short/quick supplement to Denis' previous article about the Munich School of Engineering (MSE) colloquium. I uploaded my poster to show people so...
The poster illustrates our current state of research in the direction of formal software and systems engineering methods for the energy system domain.
In particular, due to the interdisciplinary nature of the colloquium our scientific background and current challenges are highlighted.
From there preliminary results and an outlook are given.

---
### Smart Grid Research Initiative
- URL: https://hackenberg.tech/posts/2012_06_19_smart_grid_research_initiative/
- Date: 2012-06-18
- Tags: dynamic-programming, energy-systems, teaching
- Summary: The last weeks my colleagues and I have been working on a website to promote our smart grid research and communicate with other researchers and practitioners fr...
To keep this article short I will only provide a screenshot and a link to the new website.
The web design is a custom development of our group.
We tried to make navigation simple and give short taglines that convey our ideas and philosophies.
[](http://smartgrid.in.tum.de/)
---
### Visualizing our Smart Grid Simulation
- URL: https://hackenberg.tech/posts/2012_06_11_visualizing_grid_simulation/
- Date: 2012-06-10
- Tags: data-visualization, dynamic-programming, energy-systems, simulation, youtube-video
- Summary: At ICSE I presented our initial model for simulating the smart grid including both physical and software components. To help developers analyse their systems we...
The simulation setting for the proof of concept is simple:
We investigate the behavior of a single household including a lamp and a refrigerator.
Further, user and weather provide scenario-like input for the system components.
Finally, the refrigerator is already controlled by some sort of ICT component/software.
However, the control software is very basic:
Start cooling as soon as temperature rises above a certain threshold.
Enjoy the demonstration and leave comments if you like!
---
### My SE4SG Presentation
- URL: https://hackenberg.tech/posts/2012_06_05_se4sg_paper_presentation/
- Date: 2012-06-04
- Tags: conference, energy-systems, slideshare-presentation, systems-engineering
- Summary: I just uploaded my presentation slides for the SE4SG workshop to slideshare to give you the opportunity to review my talk. I hope everybody enjoyed the presenta...
If you have any questions or suggestions feel free to comment on the slides either on this page or on the slideshare website.
You can also always contact us via email or phone to talk with us in person.
This is always welcome.
You find the respective contact information on our profile pages of this website.
---
### SE4SG Workshop Report
- URL: https://hackenberg.tech/posts/2012_06_04_se4sg_workshop_report/
- Date: 2012-06-03
- Tags: conference, energy-systems, software-systems, systems-engineering
- Summary: Yesterday the ICSE workshop on software engineering challenges for the smart grid was held at the University of Zurich. It was a great event providing fertile g...
To give you an impression of the workshop I took a picture from inside the meeting room.
On the picture you see the three chair members as well as one of my colleagues - Pragya - during a brainstorming session.
After the presentations of the research and position papers we were thinking about how to bring forward this particular area of science in the future.
I am very optimistic things are going to pick up speed quickly and emerge into an interesting and vivid branch of computer science.

---
### Leaving to ICSE tomorrow!
- URL: https://hackenberg.tech/posts/2012_05_31_leaving_to_icse_tomorrow/
- Date: 2012-05-30
- Tags: conference, energy-systems, software-systems
- Summary: The event is approaching: Tomorrow at 11:59 AM the train is leaving to Zurich, Switzerland, where the 34th International Conference on Software Engineering is h...
If I find enough time and Internet access in Zurich I will try to blog a little bit about the event, the topics and the people.
For now have a look at the workshop website linked below to get more information.
Software engineering is starting to discover and explore the field of energy systems and - in particular - smart grids.
It's an exciting process with many opportunities!
[](http://gridoptics.pnnl.gov/se4sg12/)
---
### 3D Motion Capture Documents from my PhD Studies at EPFL.
- URL: https://hackenberg.tech/posts/2012_04_27_motion_capture_documents/
- Date: 2012-04-26
- Tags: computer-vision, gesture-recognition, motion-capture
- Summary: Recently while browsing some folders on my hard disk I discovered relicts from my time in Lausanne, Switzerland. Somehow, for me this is an interesting and exci...
I was working on tracking (human) motion fast and with high quality.
We used a virtual skeleton and infrared markers.
[](./skeleton.png)
The overall tracking problem could be split in a number of subproblems:
Finding the configuration of the trunk, the hip and the shoulders.
[](./skeleton_trunk.png)
[](./skeleton_hip.png)
[](./skeleton_shoulder.png)
To improve the workflow I created software models of the skeleton.
For rendering I used [POV-Ray](http://www.povray.org/).
[](./povray_skeleton.png)
[](./povray_markers.png)
[](./povray_scene.png)
Finally, I was working on an interface for testing the data structures and algorithms.
First I created some scetches.
[](./interface_scene.png)
[](./interface_subject.png)
[](./interface_list.png)
Then I implemented a prototype in [C++](http://en.wikipedia.org/wiki/C%2B%2B) and [Qt](http://qt.nokia.com/products/).
The prototype was based on a custom C++ plugin framework.
[](./screenshot.png)
In another article I might show you how the custom C++ plugin framework was implemented.
It was actually a very interesting experience for me, as plugin framework design turns out to be a challenging task.
---
### Software logo sketches with graphics tablet/pen.
- URL: https://hackenberg.tech/posts/2012_04_24_software_logo_tablet_pen_sketches/
- Date: 2012-04-23
- Tags: drawing
- Summary: In a previous article I showcased some logo ideas I created with Inkscape and Gimp. In the mean time I bought a Tablet PC with Stylus and discovered a little to...
You can also find the logos on the [Hyperkit Software Portal](http://www.hyperkit-software.com/index.html).
In the following, the logos are grouped thematically.
The first group includes everything concerning the **Web**
[](http://www.hyperkit-software.com/projects/webcollections/index.html)
[](http://www.hyperkit-software.com/projects/webcrawler/index.html)
[](http://www.hyperkit-software.com/projects/webevents/index.html)
[](http://www.hyperkit-software.com/projects/webprojects/index.html)
[](http://www.hyperkit-software.com/projects/webversions/index.html)
The second group is dedicated to **C++** projects.
[C++](http://en.wikipedia.org/wiki/C%2B%2B) is a programming language developed by Bjarne Stroustrup at Bell Labs in 1979.
Today, it is one of the most popular programming languages with many application areas.
[](http://www.hyperkit-software.com/projects/cppinterpolate/index.html)
[](http://www.hyperkit-software.com/projects/cppsimulate/index.html)
The third group is formed of **PHP** and **SVN** projects.
[PHP](http://en.wikipedia.org/wiki/PHP) is another popular programming language mainly used for web sites.
Instead, [SVN](http://en.wikipedia.org/wiki/Apache_Subversion) is a file versioning tool mainly used for team work.
[](http://www.hyperkit-software.com/projects/phptemplates/index.html)
[](http://www.hyperkit-software.com/projects/svnwiki/index.html)
The final group is compiled from **JavaScript** projects.
[JavaScript](http://en.wikipedia.org/wiki/JavaScript) is a last popular programming language that runs in the browser and allows to develop highly interactive web experiences.
[](http://www.hyperkit-software.com/projects/jsgraphs/index.html)
[](http://www.hyperkit-software.com/projects/jsphysics/index.html)
Sketching these logos has been a matter of minutes with a Tablet PC and MyPaint.
Of course, in most projects the sketches won't be used as the final versions of the logo.
But they serve as immediate drivers towards the final version.
---
### Second report on smart grid simualtion.
- URL: https://hackenberg.tech/posts/2012_04_19_smart_grid_simulation_report/
- Date: 2012-04-18
- Tags: dynamic-programming, energy-systems, simulation
- Summary: We are not there yet, but we are making good progress! That's probably the message of this second report on smart grid simulation (see first report). This artic...
The screenshot shows the simualtion results for a system configuration.
The system configuration includes a single low-voltage net with ten households, two wind farms and two solar plant.
The households are further decomposed into five lamps, one refrigerator and one electric power storage.
The time axis shows the component states in sequential order.
[](./screenshot.png)
Currently, all devices in the system are switched off by default.
However, the mid-term goal is to develop smart algorithms that control the devices.
Smartness refers to the ability to keep the electric power system in balance while meeting user requirements.
The current system configuration serves as a virtual testbed for evaluating smart control approaches.
If you are interested in knowing more about the software and the approach behind just contact me via this page or via email!
---
### Smart grid seminar started today!
- URL: https://hackenberg.tech/posts/2012_04_16_smart_grid_seminar/
- Date: 2012-04-15
- Tags: dynamic-programming, energy-systems, teaching
- Summary: Today the spring term started at the Technical University of Munich and so did our newly created smart grid seminar. The goal of the seminar is to teach young s...
For now you can find more information about the seminar on the [seminar webpage](http://www4.in.tum.de/lehre/seminare/SS12/sesgs/index.shtml):
[](http://www4.in.tum.de/lehre/seminare/SS12/sesgs/index.shtml)
Stay tuned on our smart grid learning and teaching activities!
---
### Introducing Timeline Navigation and Facebook Like
- URL: https://hackenberg.tech/posts/2012_04_12_timeline_navigation_facebook_like/
- Date: 2012-04-11
- Tags: blog, user-interface, ux-design, web-development
- Summary: To improve the usability of my blog I worked on two new features: (1) The timeline navigation and (2) the Facebook like button. When reading an article, the tim...
First, here are two screenshots of the new features:
[](./facebook.png)
[](./timeline.png)
The **left** screenshot shows the Facebook like button on the article list pages.
In fact, you can find the button anywhere where an article is linked.
This way, each article link is enriched with information from the community.
The blog visitor can use this information to navigate to interesting content.
By liking an article the visitor has the possibility to indicate interesting articles to other visitors.
The **right** screenshot shows the timeline navigation.
When reading an article, the timeline navigation provides links to older and more recent articles.
This way the visitor can browse through the blog in chronological order.
Again, the article links are enriched with community likes to point out interesting content.
I hope you like the new features.
If so, you can tell me via Facebook! `;-)`
---
### Paper accepted for ICSE'2012 workshop on SE4SG!
- URL: https://hackenberg.tech/posts/2012_04_05_icse_2012_se4sg_workshop_paper/
- Date: 2012-04-04
- Tags: conference, energy-systems, software-systems, systems-engineering
- Summary: I am happy to announce that my colleagues Maximilian Irlbeck, Vasileios Koutsoumpas, Denis Bytschkow and I successfully published a paper on applying formal sof...
Here's a little teaser for the paper.
The conference is held at the beginning of June in Zurich, Switzerland.
This year's main theme is "sustainable software for a sustainable world".
After the conference days you will be able to access the full version of the paper as part of the conference proceedings.
The conference proceedings are typically distributed both in digital and in printed format.

If you are interested to read more about SE4SG access the workshop website.
The website provides interesting background information about the organizations and people behind the scenes.
Overall, SE4SG is a first step towards broadening the discussion about interfacing software engineering and electrical engineering for sustainable energy supply.
[](http://gridoptics.pnnl.gov/se4sg12/)
I hope this article gave you an insight into current developments in my area of research.
Stay tuned along the road towards a better energy future!
It's a topic that matters for everybody.
---
### 3D Multi-Touch Master Thesis
- URL: https://hackenberg.tech/posts/2012_03_15_3d_multi_touch_master_thesis/
- Date: 2012-03-14
- Tags: motion-capture, gesture-recognition, computer-vision, user-interface
- Summary: Due to the overwhelming response from the research community over the past 2 years I decided to put online my Master Thesis written at Fraunhofer FIT. I hope my...
The thesis documents two approaches I have tried to implement computer vision based 3D hand gesture interaction.
The more promising approach is selected to implement a first prototype for evaluation with users.
Finally, the findings are summarized and future work is listed.
If you have feedback or questions please do not hestitate to contact me!
Use the comment feature below to give other people the chance to engage into the discussion.
---
### First Results on Smart Grid Simulation as YouTube Video
- URL: https://hackenberg.tech/posts/2012_02_23_smart_grid_simulation_video/
- Date: 2012-02-22
- Tags: data-visualization, dynamic-programming, energy-systems, optimization, simulation, youtube-video
- Summary: The last weeks my colleagues and I have been working hard on a basic simulation of a household with electric components and control software. We show first resu...
In the video the individual system components are displayed with respective icons.
Between the components physical measurements such as temperature and electric power as well as user interaction events are shown.
Finally, the simulation time runs from midnight of the previous day to mignight of the current day.
See yourself:
The visualization in the video is based on a data series generated by the simulation.
Originally, the simulation data is available in CSV (comma-separated values) format as shown in the next screenshot.
The format has been selected to allow importing the simulation data directly into Microsoft Excel and other spreadsheet solutions.
[](./csv.png)
The representation in spreadsheet format has the great advantage, that charts can be easily built from it.
In the following, two examples are provided:
(1) The temperature curve for the interior of the refrigerator.
And (2) the electric power curve for the household at the interface to the low-voltage net.
This is another from of visualization that helps analyzing system behavior.
[](./temperature.png)
Refrigerator temperature curve
[](./energy.png)
Household power curve
The visualization itself is rendered inside a browser with JavaScript and SVG.
Therefore the data series is transformed into a two-dimensional JavaScript array.
The transformation is straightforward: Rows in the spreadsheet are array indices in the first dimension, while columns are indices in the second dimension.
[](./javascript.png)
Right now we are working on extending the simulation model and developing better visualizations on top.
Ultimalte goal is a true large-scale simulation model for developing and testing smart control algorithms.
---
### Software Campus - A new academic excellence program.
- URL: https://hackenberg.tech/posts/2012_02_13_software_campus_fellowship/
- Date: 2012-02-12
- Tags: award, dynamic-programming, data-visualization, machine-learning
- Summary: To promote young computer scientists on their way to management or entrepreneurship a consortium of leading German corporations and the Federal Ministry of Educ...
The idea of **Software Campus** is to support Master and PhD students with funds for their very own research project (up to EUR 100.000) as well as contacts to relevant industry partners.
From project funding the students are expected to learn how to manage projects in practice while the industry partners provide mentorship and soft skill training.
In my case the project is centered around my work on energy systems and ICT (Information and Communication Technology) engineering for the future *smart grid*.
Other topics include advanced dialog systems for online shops and smart city test beds.
Overall, there is a wide selection of topics that address central future challenges for society and industry.
Industry partners include among others **Siemens**, **SAP**, **Software AG** and **Bosch**.
In my particular case I am affiliated to [Siemens Corporate Technology](http://www.siemens.com/corporate-technology/en/index.php), the R&D (Research and Development) branch of the Siemens AG.
The industry partner helps to sharpen the project vision, provides mentorship throughout the project and supports development of leadership skills in seminars and workshops.
Overall, this frameset provides a great opportunity for industry-driven research, feedback and focus.
Finally, here is a picture of the eleven selected pilot PhD students with the **German Chancellor Dr. Angela Merkel**, the **Vice Chancellor Dr. Philipp Roesler**, the founder of the *Scheer Group* **Prof. August-Wilhelm Scheer** and the CEO of the *SAP AG* **Jim Hagemann Snabe**.
This picture was taken at the [2011 National IT Summit](http://www.it-gipfel.de/) in Munich, an occasion where the German IT industry comes together and discusses past evolutions and future strategies.
[](./group.jpg)
Copyright 2011 Wolfram Scheible
I hope this article got you interested in the excellence program.
From what I have experienced so far I can tell it is a great chance for all participants including the PhD students and the companies.
Soon the application for the next round will be open.
Have a look at the official website and be prepared to apply!
---
### Managing Our Team Roadmap with MediaWiki
- URL: https://hackenberg.tech/posts/2012_01_17_mediawiki_team_roadmap/
- Date: 2012-01-16
- Tags: collaborative-software, hyperkit-software, knowledge-management, task-management
- Summary: Recently, a few colleagues and I founded a working group around the topic of software engineering for future energy systems (also called smart grids). To coordi...
The roadmap is basically a collection of current tasks and events.
The tasks are devided into four time frames:
(1) Immediate, (2) short term, (3) middle term and (4) long term.
Instead, the events are devided into three categories:
(1) Important, (2) prebooked and (3) publication deadlines.
Here is a screenshot:
[](./roadmap.png)
The layout of the roadmap is created with a simple MediaWiki table.
To keep the table code lightweight, the actual tasks and events are outsourced into template pages and included with the `{{PageName}}` syntax (highlighted in the following screenshot).
[](./editor.png)
Finally, the template pages cotain simple bullet point lists of the tasks or events in the given time frame or category respectively.
Typically we add links from the bullet points to extended information on the topic.
For example, the last entry in the following screenshot references an encrypted URL for another domain.
[](./template.png)
Once a week we meet to update the common roadmap.
So far this strategy has proven worthwhile.
---
### JavaScript/SVG Tag Graph Interface
- URL: https://hackenberg.tech/posts/2012_01_05_javascript_svg_tag_graph/
- Date: 2012-01-04
- Tags: blog, data-visualization, hyperkit-software, javascript, knowledge-graphs, user-interface, zumida
- Summary: Here's another interface in the series of JavaScript/SVG interactive respectively animated prototypes: The tag graph. The idea is to display the article tags as...
The implementation is compatible with recent versions of **Internet Explorer**, **Mozilla Firefox**, **Opera** and **Google Chrome/Apple Safari**.
The following image shows a sample output for this blog.

The graph is generated using **PHP**, layouted using **JavaScript** and rendered using **SVG**.
The PHP script basically generates lines for connections between tags, and circles/text elements for the tags themselves.
Most of the code is specific to my custom blogging API.

The JavaScript contains the magic behind the interface.
Upon page load the tags are arranged randomly on the canvas.
Then, an interval is started to move the tags to their final location step by step.
The update functions finally copy the layout algorithm values to the DOM SVG nodes.

Try it out yourself: `http://www.georg-hackenberg.de/interface/graph.html`.
If you would like to provide such interface for your own website, access the code via [http://svn.hyperkit-software.com/personalblog/](http://svn.hyperkit-software.com/personalblog/).
---
### Revised PHP/XML Blog Implementation
- URL: https://hackenberg.tech/posts/2012_01_04_revised_php_xml_blog_implementation/
- Date: 2012-01-03
- Tags: blog, data-visualization, software-systems, web-development
- Summary: After another year of up-time it was time to revise some parts of the blog implementation. Originally, I did not pay much attention to the file structure. Howev...
The files of the blog are distributed to six folders:
(1) **content** stores variable data for each blog installation,
(2) **controller** contains PHP scripts that descide how to process HTTP requests,
(3) **model** contains PHP classes that reflect the content,
(4) **script** contains JavaScripts required by the user interface,
(5) **theme** contains Cascading Stylesheets and images for the user interface,
and (6) **view** contains PHP scripts that generate the HTTP responses.
[](./main_folders.png)
The **content** folder mainly contains the **article** folder, which stores the individual blog articles.
Each blog article is represented by a folder whose name contains the article **date** and **id** (e.g. `2009_02_11_personal_website_launched`).
This folder contains the **article.xml** file and other documents such as images or PDFs.
The XML file provides information about the article **headline**, **tagline** and **content**.
Typically, the **content** section refers to the attached documents.
[](./content.png)
The **controller** folder currently only contains a single script called **main.php**.
The purpose of the script is to load the content using the **model** classes and to redirect the HTTP request to the respective **view**.
Further, for raw content such as images or PDF documents the correct file path is derived using a **base** path and the request URL.
[](./controller.png)
The **model** folder currently contains three classes:
(1) **Database** represents the root of the content model,
(2) **Article** represents a blog article with direct access to headlines, taglines, content and attached documents,
and (3) **File** represents attached documents.
The class implementations typically use file system operations and the *SimpleXML API* for loading the stored content.
[](./model.png)
The **script** folder currently contains JavaScript files for
(1) the Dashboard image slideshow and
(2) the four different blog interfaces (Calendar, Cover, Tile, Timeline).
Scripts (and **theme**) are separated from **content** to make it possible to exchange content while keeping appearance and interactivity.
[](./script.png)
The **theme** folder contains (1) images and (2) Cascading Stylesheets.
Through separating theme files from content it is possible to have several blog installations run the same theme with different content.
It is intended to install themes by checking out a respective theme SVN repository.
[](./theme.png)
The **view** folder currently contains scripts for
(1) the **header** and **footer** (reused by other views),
(2) the **index** (also called *Dashboard*) and **article** pages,
(3) the **RSS feed**,
and (4) the **error** page.
Further, scripts are provided for specific files extensions such as **JPEG** or **PDF**.
In particular, the image extension scripts provide functionality to rescale and crop image files.
Finally, the folder **interface** contains the views for the different blog interfaces (Calendar, Cover, Tile, Timeline).
[](./view.png)
These files are currently all that is required for running a simple PHP/XML blog.
If you are interested you can access the entire sources via the public SVN repository: [http://svn.hyperkit-software.com/personalblog/](http://svn.hyperkit-software.com/personalblog/).
---
### Promotional Smart Grid Videos
- URL: https://hackenberg.tech/posts/2011_08_12_promotional_smart_grid_videos/
- Date: 2011-08-11
- Tags: drawing, energy-systems, youtube-video
- Summary: Currently I am working hard to understand ongoing efforts for revolutionizing the energy supply systems across the globe. In a recent article - a View onto the ...
As usual I have also done some meta-level thinking, i.e. thinking about the causes and effects of watching these YouTube videos.
What I came up with is an illustration of the process leading from the opaque topic cloud via YouTube to a transparent mental picture.
The question whether this illustration is complete or even adequate I cannot anwser, but what I can say is that it reflects my own situation rather well.
[](./youtube_research.jpg)
The first video - and my favourite - demonstrates [Cisco](http://www.cisco.com/)'s vision of a revolutionized energy system.
Of course the video's content is a little coloured towards Cisco's products and services that generate value in the smart grid change process.
However, this coloring also has a positive effect: The illustration is very plastic.
But watch yourself!
In contrast, the second video - published by the [Scientific American](http://www.scientificamerican.com/) - is a little more unbiased and tries to explain the smart grid movement from both a technical and a historic perspective.
I think, the video gives a good introduction to the topic despite being very compact and reduced in content.
I hope these two videos provide a good motivation for working in the area of smart grids and energy systems.
Doing research in this area myself now for about one month my excitement and couriousity for the topic is always increasing, as are the [questionmarks](/posts/2011_07_25_mental_picture_science/) in my head `;-)`.
---
### Official 3D Multi-Touch Websites
- URL: https://hackenberg.tech/posts/2011_07_29_official_3dmt_websites/
- Date: 2011-07-28
- Tags: motion-capture, gesture-recognition, computer-vision, user-interface
- Summary: Recently, two websites went online about the 3D multi-touch prototype that I developed during my Master thesis at Fraunhofer FIT. They serve as the public hub f...
First, there is one single page providing all important online information from *screenshots* to *videos* to *papers* to *presentations* to *links*, which you can find at [3DMT (at) Georg Hackenberg (dot) de](http://3dmt.georg-hackenberg.de).
This website has also been submitted to the [2011 Joint Virtual Reality Conference (JVRC)](http://www.nottingham.ac.uk/jvrc2011/index.aspx) *WOW-factor competition* from which we expect intersting and valuable expert feedback.
Second, there is the [Fraunhofer FIT project website](http://www.fit.fraunhofer.de/fb/cscw/projects/3d-multi-touch_en.html) which provides further institute-related information about the project.
[](http://3dmt.georg-hackenberg.de)
[](http://www.fit.fraunhofer.de/fb/cscw/projects/3d-multi-touch_en.html)
We hope these two public website will make it easier for you to get the information you need and to get in touch about collaborations and other forms of involvement around the topic of *3D interaction*.
We believe it is just the beginning of this branch of technology and there is great potential for solutions and products on a quickly emerging market.
So better jump on the train!
`;-)`
---
### A Mental Picture of Science.
- URL: https://hackenberg.tech/posts/2011_07_25_mental_picture_science/
- Date: 2011-07-24
- Tags: drawing
- Summary: Having worked for some time both in research and development and on my PhD, I started to reflect on my work to gain an observer's perspective. In this article I...
A typical picture people have in mind when talking about science is "standing on the shoulder of giants".
I believe this metaphor to fit well, not at last because of the education and tools necessary to get to the point where you can start contributing to humanity's knowledge universe (both in content and encoding).
My illustration picks up this idea, but uses a Greek temple as the giant instead (after all I come from a technical domain and as such I feel more affine to architectural craftwork than mythical creatures `;-)`).
Now, at the edge of our knowledge (the roof of the temple) we have tools (e.g. a telescope) in place to watch and observe the unexplored space.
While doing so, question start forming in our heads and discharging into the scientific community, some questions being more important than others, some being more difficult, some being more theoretical, some more practical.
[](./whiteboard.jpg)
As I come across new mental pictures of the scientific process I will try to keep you posted.
Personally, I am very much interested in illustrating such complex ecosystems and their governing rules.
---
### View onto the Energy System
- URL: https://hackenberg.tech/posts/2011_07_22_energy_system_views/
- Date: 2011-07-21
- Tags: drawing, energy-systems, systems-engineering
- Summary: Lately I got interested in the domain of energy supply systems for human society. It is currently one of the hottest topics all in politics, science, research &...
When you try to understand the challenges humanity is facing when it comes to energy supply, you probably want to start with learning about the current infrastructure and the way it works.
Simplified, the current energy network is a rather simple structure supporting single direction energy flow from producers to consumers.
Producers can be anything from local water works to regional coal-fired power plants to nuclear power plants.
The producers supply the energy network with energy, usually at high voltages for transportation over long distances.
The more local a physical energy network (the cables) get, the lower voltages are used over the wire.
Power transformers are used to down-scale the voltage level at discrete locations in the network.
[](./end_to_end.jpg)
This end-to-end view (producer to consumer) is complemented by illustrations of the general network topology.
Currently, more centralized topologies are in place where energy is produced at few locations and distributed in a star-like fashion (first diagram).
When taking the down-scaling of voltages for local distribution networks into the picture, the topology changes into a tree-like structure with a trunk and branches (second diagram).
In general, many different topologies can be imagined as for example a more bus-like setup where everybody is connected directly (third diagram).
But finally, the political vision is to de-centralize the generation of energy e.g. through local wind power but keeping the network connected for energy and energy-related information exchange (fourth diagram).
[](./central.jpg)
[](./hierarchy.jpg)
[](./bus.jpg)
[](./decentral.jpg)
In sum I believe the energy domain offers an exciting playground for contributing to a technological revolution with planned and anticipated sustainable impact.
I will try to keep you posted about the process and the progress of this national and international ambition.
I think we all can be excited about an energetic but energy-neutral future society and life foundation.
---
### Artistic Exercises
- URL: https://hackenberg.tech/posts/2011_07_21_artistic_exercises/
- Date: 2011-07-20
- Tags: drawing
- Summary: Last weekend I was visiting friends in Berlin. Many of them work in the creative domain being photographers, journalists, and artists. It has been an interestin...
The first drawing formed while I was talking two [Melissa Steckbauer](http://melissasteckbauer.weebly.com/).
She's an artist from Wisconsin, US, and working and living in Berlin, Germany.
The drawing probably reflects our talk as well as an instance of collaboration and creative team processes.
Both of us worked on pretty much each part of the canvas while alternating.
What I learned in this process is that collaborative drawing is a good tool for communication.
What I cannot say is in what way it influences a conversation and contributes to the exchange of ideas, viewpoints, and general information.

The second drawing formed while I was thinking about things that I value in life.
In this particular situation my train of thought boiled down to my very own understanding of freedom.
I say very own because different people might understand different things when talking about freedom and their associations connected with it.
In this drawing I interpret freedom as the possibility to add any element that comes to my mind anywhere in the picture without limiting myself to arbitrary constraints (e.g. beauty, symmetry, esthetics, color, content, etc).
In a way similar to the previous drawing this picture formed in a process around a central element (activity, term)

In sum I came to the conclusion that arts is defined by a process around a topic with the goal to express ones mental pictures in context with associated emotions.
Alright, probably arts cannot be defined in such a short sentence with such simple concepts, but still I feel it gives me a better interpretation of the domain as well as a sense of methodology and value.
In particular I have the impression that artistic approaches can help express the content of abstract domains such as computer science (which hopefully provides the link to the topic of my blog `;-)`).
---
### 3D Multi-Touch with Computer Vision
- URL: https://hackenberg.tech/posts/2011_07_14_3dmt_computer_vision/
- Date: 2011-07-13
- Tags: motion-capture, gesture-recognition, computer-vision, user-interface
- Summary: Some time ago I was working on free hand 3D gesture interfaces similar to Microsoft Kinect. What this work essentially means is collecting digital camera images...
Some time ago I was working on free hand 3D gesture interfaces similar to Microsoft Kinect. What this work essentially means is collecting digital camera images...
This **first** visualization illustrates how the original image contents are segmented into regions of consistent depth.
This segmentation is used to find those pixels that are interesting for further processing steps thereby limiting the complexity of the input to the algorithm.
This **second** visualization illustrates the process of calculating for each pixel the distance to the closest depth discontinuity.
The idea of this step is to find candidates for palms as pixels with the largest distance (equal to the white spots in the visualization).
This **third** visualization illustrates the process of finding candidates for finger tips in the image.
Constructing this process has been one of the main contributions of my work.
Explaining the details would go into mathematical details, which I believe are not interesting at this point.
This **fourth** visualization illustrates the process of finding the fingers (or finger pipes as we call it) in the image.
The process is similar to finding finger tips and I believe the same argument holds for not explaining the details of this visualization.
This **fifth** visualization illustrates the process of estimating the skeleton of the objects that are visible in the camera image.
This approximate skeleton provides valuable information when it comes to classifying the actual palm locations by confining the search to topology endpoints.
This **sixth** visualization illustrates the process of extracting finger-like structures from the image contents.
Each of the selected finger structures is annotated on top of the depth image using two green circles (for tip and base) connected by a green line.
This **seventh** visualization illustrates the process of grouping various image features to candidates for the hand recognition and tracking step.
Each candidate is annotated using the palm circle and finger structure annotations from the previous step, all in random color.
This **eighth** visualization illustrates the process of tracking hand appearances over time across the image plane.
The current location of the palm is annotated with a green circle, while the locations in the previous frames are annotated through a green line.
Finally, the red top of the line is the prediction for the current frame calculated from the previous motion.
What I wanted to show with this article is how visualization can make a problem/solution/system more comprehensible.
The visualizations provided in this article have a concrete practical background as they were taken from my Master thesis compendium.
Further, the computer vision domain lends itself to a fairly natural and intuitive class of visualizations constructed from the original image contents.
This class might not be available in every domain, in particular the more abstract and theoretical ones.
However, I believe there is almost always an added value in drawing a picture about something, especially when you don't have a clear picture about it in your head.
---
### Fraunhofer Prize Award 2011
- URL: https://hackenberg.tech/posts/2011_07_04_fraunhofer_prize_award_2011/
- Date: 2011-07-03
- Tags: award, motion-capture, gesture-recognition, user-interface, computer-vision
- Summary: After finishing graduate classes at RWTH Aachen University I decided to go to Fraunhofer FIT, a non-profit R&D organization at the interface between science...
Each year the Hugo Geiger Prize awards three outstanding application-oriented Master thesis'.
The prize has been set up by the [Bavarian Ministry for Economy, Infrastructure, Transport and Technology](http://www.stmwivt.bayern.de/).
It is named after the German politician [Hugo Emil Otto Conrad Geiger](http://de.wikipedia.org/wiki/Hugo_Geiger), who served besides other roles as the patron when founding the Fraunhofer Association back in 1949.
Since then the association has developed to Europe's largest organization for applied research and development services employing more than 18,000 professionals.
[](./main.png)
[](./hugo_geiger.png)
It has been a great honor to receive this prestigious award and to participate in the well-staged award ceremony moderated by [Ursula Heller](http://www.br-online.de/bayerisches-fernsehen/muenchner-runde/muenchner-runde-moderator-heller-ID1202920745505.xml).
Amongst others the Chinese Minister of Science and Technology [Prof. Dr. Wan Gang](http://en.wikipedia.org/wiki/Wan_Gang) and the Bavarian Minister of the Interior [Joachim Herrmann](http://www.joachimherrmann.de/) gave interesting talks about the role of science for society and a commitment to globally sustainable technological and social progress.
About my conclusion I am still pondering. `;)`
---
### Blog Cover Interface
- URL: https://hackenberg.tech/posts/2011_06_30_blog_cover_interface/
- Date: 2011-06-29
- Tags: blog, data-visualization, user-interface
- Summary: In the previous post I demonstrated Animated Article Tiles, a new type of interface for blogs. One problem people had using the interface was that the images/ti...
This new concept essentially means that only one article at a time is being displayed.
For the displayed article all information (date, title, tagline, and images) is provided.
Through the `(p)`revious and `(n)`ext keys the user can switch between the articles.
Interaction with the mouse is not necessary.
To make the interface more attractive the images are provided both as thumbnails below the article tagline and as a slideshow in the right part of the interface.
[](./screenshot_one.png)
[](./screenshot_two.png)
The idea was actually inspired by two concepts: The article tiles and the standard cover flow.
In the future it might be interesting to extend the interface with a flow-style animation when switching between articles.
Also a widget showing the current position in the timeline could facilitate navigation through the articles.
However, to scale to large numbers of articles only an excerpt from the timeline might be interesting.
---
### Animated Article Tiles
- URL: https://hackenberg.tech/posts/2011_06_29_animated_article_tiles/
- Date: 2011-06-28
- Tags: blog, data-visualization, user-interface
- Summary: In my previous posts Blog Calender Interface and Blog Timeline Widget I demonstrated how to use the time information to build navigation controls for blogs. In ...
The idea of the interface is to list all blog articles chronologically as tiles on a single page.
The tiles should contain the title of the article as well as all contained images.
Only one image should be visible at a time and a blend effect should switch between the images.
And this is what the prototype of the interface looks like:
The left screenshot shows the original version, the right screenshot depicts the most recent evolution of the interface.
[](./screenshot.png)
[](./screenshot_two.png)
Again this is just another try at making blogs more fun and easy to navigate.
What I like about this attempt is the animation of contents giving a more dynamic and lifely impression of the contents.
I think a disadvantage is the amount of information provided at a single sight.
This makes it difficult to grasp an overview and might make people feel lost at first.
---
### Blog Calendar Interface
- URL: https://hackenberg.tech/posts/2011_06_28_blog_calendar_interface/
- Date: 2011-06-27
- Tags: blog, data-visualization, user-interface
- Summary: In my last post Blog Timeline Widget I demonstrated how to provide a timeline for navigating your blog posts. In this article I show a modified version of the i...
The left screenshot shows the main interface after loading the page.
The articles are organized in a tabular structure.
Years are marked vertically, months horizontally (resulting in a two-dimensional grid).
The articles are contained in the table cells.
When hovering the article icons a bubble is displayed showing detailed information about the blog post.
This effect is illustrated in the screenshot to the right.
[](./main.png)
[](./bubble.png)
Again the interface is only work in progress to provide innovative navigation controls for information on the internet (in my particular case blog posts).
Mainly it is intended to document the progress, showcase ideas, and maybe find some people that are interested in sharing ideas.
I believe there is great potential for a new class of interactive web information systems that are fun to browse, easy to use, and give a good impression of the contents, products, and services underneath.
---
### Blog Timeline Widget
- URL: https://hackenberg.tech/posts/2011_06_27_blog_timeline_widget/
- Date: 2011-06-26
- Tags: blog, data-visualization, user-interface, youtube-video
- Summary: The main purpose of a blog is to provide access to articles (HTML documents) organized by date. To reflect this idea I designed a timeline that visualizes the t...
First here are the screenshots of the widget taken with the latest stable Opera web browser (though other recent browsers can be used as well).
The left image shows the interface directly after loading the web page.
The right image illustrates the effect when hovering over dots in the timeline fading in a bubble with information about the underlying blog post.
[](./interface.png)
[](./bubble.png)
The usage of the widget is further illustrated in the following YouTube video.
You can see how interaction with the widget is carried out.
Please note that the YouTube video shows a previous version of the widget with less visual detail.
The widget is probably not perfect yet, but I think you get a good idea what future visualization and navigation concepts might look like.
The platform for developing and running these applications is already available with all major modern web browsers.
It is now on us to use these capabilities the best way we can.
---
### Interactive Animated Sitemap
- URL: https://hackenberg.tech/posts/2011_06_22_interactive_animated_sitemap/
- Date: 2011-06-21
- Tags: hyperkit-software, zumida, knowledge-management, data-visualization, user-interface, youtube-video
- Summary: Last summer I had the chance to develop an innovative sitemap widget for the company Le-Tex, which was intended for use at the international book fair in Frankf...
This first set of screenshots illustrates the evolution of the widget over the project period.
First the basic layout algorithm had to be design and implemented, then things like color and shading where added.
The development of such innovative interaction technology is a highly creative and exciting process, which I can recommend to any programmer interested in information visualization and human-computer interaction.
[](./version_1.png)
[](./version_2.png)
[](./version_3.png)
What does not become clear from the screenshots is the concept for interaction and animation.
Therefore I prepared a screencast which is uploaded to YouTube for public access.
The screencast shows an exemplary sequence of interactions between user and graph widget.
Interaction takes place by clicking the pages and dragging them into the center for accessing page-specific information (such as connected pages).
Personally, this was a very interesting and exciting project for me and I am happy to share this information with you.
If you have questions or would like to know more about my experiences with developing such kind of technology do not hesitate to contact me.
---
### Describing the Structure of Information
- URL: https://hackenberg.tech/posts/2011_06_21_information_structure_notation/
- Date: 2011-06-20
- Tags: data-visualization, drawing, knowledge-management
- Summary: In a previous article I explained the basic Information Visualization Problem caused by the vast space of options for visual design. In this article I concentra...
Consider the case of a blog, where articles are organized by date.
Further, the articles my contain any number of images and videos.
In particular, this information structure serves as the foundation of this website.
Now, in UML this structure would be visualized as follows.
`Blog`, `Article`, `Image` and `Video` are the basic information blocks each depicted by a box.
The lines between the boxes define the associations of the information, e.g. an article my contain several images respectively videos, where a blog may contain several articles.
The `*` (star) sign indicates the number of admissable instances of the particular information block, e.g. a blog may contain any number of articles and an artcile may contain any number of images/videos.
[](./uml.jpg)
Now compare the above visualization to the following variation, where more figurative illustrations of the information blocks are provided.
Again, the same notation is used to describe the associations between the blocks.
However, the blocks themselves are depicted by content-specific icons rather than abstract content-unspecific box shapes.
In the case of a blog this extended visualization might not add much information because for many readers the terms *blog*, *article*, *image*, and *video* have already associated a clear mental picture.
In other cases these mental pictures might not be as obvious (e.g. the information blocks `Tag`, `Category`, or `Tutorial`), and a more illustrative approach can actually contribute to the understanding of the structure.
[](./custom.jpg)
My concluding argument is that I believe more figurative visualizations of information are in many cases superior to content-unspecific visual notations.
However, in this article this only applies to information blocks and not to associations between these blocks.
Questions that arise from these considerations are (1) the value of figurative illustration, (2) the extend of figurative illustration, and (3) the tool support for effective creation.
---
### From Layout to Animation
- URL: https://hackenberg.tech/posts/2011_06_16_from_layout_to_animation/
- Date: 2011-06-15
- Tags: blog, drawing, user-interface, ux-design, youtube-video
- Summary: In a previous article The Evolution of a Functional Prototype I demonstrated how to transform sketches into prototypes backed by database content and applicatio...
To provide some context for this article here are the images from my previous post that illustrate the change from whiteboard sketch to functional prototype.
You can see how the sketch ideas are transformed into a more formal HTML description of layout and content.
[](./../2011_06_11_functional_prototype_evolution/start.jpg)
[](./../2011_06_11_functional_prototype_evolution/intermediate.png)
[](./../2011_06_11_functional_prototype_evolution/end.png)
Since the interface only displays navigation structures the question is how to integrate the actual contents.
I.e. what should happen if the user clicks one of the links in the navigational interface, and how to get back from the content (e.g. blog article) to the navigation.
Traditional websites reload the entire page every time a navigation link is clicked.
My goal was to break this paradigm and introduce smoother transitions between displayed contents.
However, there are many options to implement this requirement.
In the following, two approaches are illustrated as YouTube videos.
In the left approach the top header bar stays visible all the time.
Getting back to the navigation simply requires clicking this top bar for the navigation contents to be slided in again.
One disadvantage I felt this approach has is that the top bar always takes up unnecessary space.
Therefore I worked on a second concept shown in the video to the right.
Here navigation and content are two screens that are arranged horizontally.
However, only one of the screens is displayed at a time and transition between them is animated as a slide effect.
Consequently, less navigation-related content is displayed on the screen when reading e.g. a blog article.
In future posts I'll try to understand the usability aspects of either approach and push the interface forward to an ultimately fun, effective, and efficient experience that is beyond traditional web interfaces.
---
### The Evolution of a Functional Prototype
- URL: https://hackenberg.tech/posts/2011_06_11_functional_prototype_evolution/
- Date: 2011-06-10
- Tags: blog, drawing, product-design, user-interface, ux-design
- Summary: In a previous article From Sketch to Prototype I illustrated the change from fuzzy whiteboard sketches to more structured and formal HTML prototypes. In this ar...
Again we start by sketching the layout idea on the whiteboard.
We use different colors for grouping similar content structures.
Annotations (in our case black) are also a good idea to evoke further associations with the presented content.
[](./start.jpg)
It is probably not surprising that again I arrived at a tabular layout of my website contents.
Also the icon-style illustrations of content categories is a common pattern that I have used frequently in previous design prototypes.
Now the next step in the evolution of the interface idea is to transform the fuzzy whiteboard drawing into a more formal HTML/CSS prototype with icons downloaded from Google images.
[](./intermediate.png)
You see again some sort of transformation of the initial design proposal.
Similar to other cases horizontal and vertical color shades are introduced to separate header from content cells plus the individual columns.
On the other side the contents themselves are not elaborated well because only one type of icon is used and the text is simply copied.
However, the static prototype was already sufficient to judge the technical feasibility and decide for a functional implementation.
This functional implementation takes the next step by integrating exemplary data into the interface.
For the first column I used four random articles from my blog.
For the second column I selected four projects from my [Source Code Portal](http://www.hyperkit-software.com).
For the third column I created new content which I haven't been using before.
For the fourth column I copied the top-level structure of my resume.
[](./end.png)
In this case several transformations took place:
(1) The *Articles* column was extended because its contents were generally larger than the contents of the other columns.
(2) Column-specific icons are also used for the individual contents.
(3) The article contents are extended by publication date and a list of contained images.
This content-specific layout variation was possible because the underlying data gave the necessary inspiration.
In the following I provide you with a view onto the file structure of the functional prototype to give you a feeling of the complexity of the implementation as well as the required effort.
[](./folders.png)
[](./data.png)
[](./model.png)
[](./view.png)
[](./theme.png)
It should be noted that many parts of the implementation have been reused from existing projects.
In particular, the *Model* and the *Controller* are very similar in structure and behavior to other web applications I developed in PHP.
Therefore most of the implementation is copy and paste (as I have not thought of a better mechanism for reuse yet).
Let me know what you think if the article!
I am also interested in feedback on the prototype itself, as it might be the coming interface for my website.
---
### The Information Visualization Problem
- URL: https://hackenberg.tech/posts/2011_06_10_information_visualization_problem/
- Date: 2011-06-09
- Tags: data-visualization, drawing, ux-design
- Summary: Inspired by my pervious post about Visualizing Software Systems I started to think about the more general problem of information visualization. The major differ...
First, I introduce my thoughts that preceded the step of creating the illustrations:
At my work I am trying to understand the interaction between machines and humans.
Machines typically process data and provide some for of presentation for the user.
The data can be arbitrarily complex, while the presentation has to be simple enough for the user to understand.
Therefore, there has to be a transformation process simplifying the raw data to usable bits of content, which are then layed out on the screen (or other physical devices).
The user finally perceives the presentation and processes the information cognitively before acting upon it.
These relationships inspired me to create the following two illustrations.
[](./first.jpg)
[](./second.jpg)
The illustration to the left preceeded the illustration to the right.
The idea was to lay out the different information models horizontally (in other words sequentially) to emphazise the natural layering.
Labelled arrows between them indicate the interaction between the models.
Finally, a boundary between machine and human is drawn to group the contained concepts.
My impression of this first illustration was that it is difficult to understand the structure of the information quickly, i.e. what bits of text and drawing belong together and how are they connected.
This critique led me to the improved version to the right.
The idea was to group picture contents that belong together by closed shapes.
You can see the immediate benefit of this technique when comparing the two versions of the illustration.
Clearly, the version to the right gives a much cleaner and structured impression, though most parts of the drawings are identical.
To understand the structure of the previous two illustrations better, I decided to draw their contents in a tree format (root node, child nodes, leaf nodes).
This idea resulted in the following picture.
[](./three.jpg)
The main observation is that some image contents (the *meta level* 1 and 2) are solely used to group the actual image content (the *leaf nodes* data/content/presentation/user).
The really interesting content are the attributes and relationships of the leaf nodes in the information tree.
For the illustration this means that the meta nodes are translated into areas and boundaries, while the leaf nodes are translated into groups of text, drawings, and arrows.
Obviously, this is just a single and small example for the visualization problem and there are my more aspects to it than indicated here.
Nevertheless, I hope you gained a basic understanding for the complexity of the issue, but also the need for proper models, tools and techniques to create efficient visualizations.
---
### Comparing Interface Design Options
- URL: https://hackenberg.tech/posts/2011_06_09_comparing_design_options/
- Date: 2011-06-08
- Tags: drawing, human-computer-interaction, user-interface, ux-design
- Summary: Developing graphical user interfaces requires us to develop visual representations of information and controls. My previous article, From Sketch to Prototype, e...
Developing visual representations of information and controls is a wildly creative process.
In particular this means when executed my two independent people at the same time, or even by a single person at two different points in time, the output is probably never the same.
At first this property may seem problematic, but on a second thought you can exploit it as part of a bigger process:
Develop a set of alternatives (which come naturally) and let people choose the one they like best.
In the following the effect of this procedure is illustrated by two independent design options I created for my website.
[](./../2011_06_06_from_sketch_to_prototype/whiteboard.jpg)
[](./whiteboard.jpg)
The first design option (on the left) has already been explained in the previous article.
It features a tabular layout and various levels of grouping.
The second design option (on the right) abandons the idea of hierarchical grouping.
Instead the contents are organized horizontally by life domain (education, job, personal) and vertically by inner-domain grouping (academic degree/job type/personal interest).
Again, the drawings are followed by a prototypical implementation adding further detail to the idea.
[](./../2011_06_06_from_sketch_to_prototype/screenshot.png)
[](./screenshot.png)
The first option has been enhanced by colors and shades to improve the cognitive-visual separability of the content.
Instead, the second option was extended by introducing colors to separate header cells (education/job/personal) from content cells (academic degree/job type/personal interest).
Secondly, logos of the universities and companies have been added as opposed to writing out their name.
**A thought:**
Probably the translation process generally suffers from the same problem than the development of visual representations: The result depends on person and time and is unlikely to be the same in two independent cases.
Nevertheless, now you can give the two alternatives two a set of users and ask for their opinions.
E.g. you can ask questions like "*Which alternative do you prefer?*" or "*What advantages respectively disadvantages do you see in each alternative?*".
Then, after collecting and evaluating tons of feedback you can continue by discarding alternatives, improving alternatives, introducing independent alterations of an existing alternatives, etc.
After several repetitions of this procedure you should finally end up with a set of consolidated designs, which represent the way your users would like your software interface to be.
I hope the principles of repetitive and comparative interface design became clear through this article.
In particular, you should notice that good interface design depends on the ideas of your designers, the feedback of your users, and a proper development process bringing everything together step by step.
In the coming weeks I'll try to collect feedback to explain the workings of the following research process.
**If you like, you could for example post your answers to the above questions (preference, pros/cons) to the comment box below.
And while you're at it, tell your friends and colleagues!
The foundation of any good evaluation is the amount of feedback!**
---
### Visualizing Software Systems
- URL: https://hackenberg.tech/posts/2011_06_08_visualizing_software_systems/
- Date: 2011-06-07
- Tags: data-visualization, drawing, software-architecture, software-systems
- Summary: One problem computer science has compared to many other technical disciplines such as physics or architecture is to create and communicate mental pictures of th...
We start with illustrations that are close to the real-world and move to more abstract representations of interesting system aspects.
[](./hardware.png)
The previous pictures illustrates the hardware components needed for running the [3D Multi-Touch Prototype](/article/2010_06_27_master_thesis_video/index.html) I developed during my Master thesis at *Fraunhofer FIT*.
This type of illustration should be easy to understand as it shows real-world objects (tripod, camera, PC, flat-screen) and their connectivity (USB cable between camera and PC, HDMI cable between PC and flat-screen).
What the picture does not say is what type of software is running on the PC for getting the hand skeleton on screen.
For this purpose I created the following illustration.
[](./process.png)
This second picture illustrates the process how to get from the camera image to a classified hand gesture.
Here a certain flow of information and control is in the center of our observation.
To support this point of view the items are arranged sequentially as opposed to the previous picture, where a spacial arrangement was used instead.
[](./crawler.png)
The last picture is a rather incomplete illustration of the system architecture of a [Web Crawler Engine](http://www.hyperkit-software.com/projects/webcrawler/index.html) I developed to collect information about real estate offers in a certain region.
Here the idea is to show the role of the crawler engine (the gear) as a mediator between the users (human icons) and the real estate websites (house icons).
Again this gives a completely different understanding of software systems as opposed to the previous two illustrations.
I hope this post gave you an idea of the huge variety of illustrations that can be created for software systems, what information they carry (hardware components, process components, stakeholders, etc), and what principles guide the layout of this information (spacial, sequential, network, etc).
A clear understanding of the visualization problem and practical solutions will help making the IT world more accessible to the individuals of our society, resulting in a better interface between IT solution customers and providers.
---
### From Sketch to Prototype
- URL: https://hackenberg.tech/posts/2011_06_06_from_sketch_to_prototype/
- Date: 2011-06-05
- Tags: blog, user-interface, drawing
- Summary: I have been long thinking how to reorganize my website to migrate from a pure blogging system to a more complete personal portfolio while keeping an original bu...
Fundamental to any good interface design is to understand the contents and information that will be accessed through the software application.
Though not being part of this article I have been working on understanding my portfolio in terms of the underlying data structure.
What I came up with was (1) my resume structured into (a) my education and (b) my jobs and (2) my activities structured into (a) technical, (b) creative, and (c) personal content.
This information served as the input for a whiteboard sketch, where I tried to illustrate and organize the items in a plane.
[](./whiteboard.jpg)
You can see that the resume part of the the information structure is already worked out quite well.
However, the activities greatly lack detail, which is due to the size of my whiteboard.
Still, the general concept was clear: The information is organized in a table, each column is labeled with an icon plus text, and the columns are further grouped into different levels of categories (theory/practice, resume/activities, ...).
This information was already enough to take the next step and build a software prototype from it.
I chose to use HTML/CSS and PNG images for this step, (1) for my knowledge of these tools and (2) for their high flexibility.
[](./screenshot.png)
As you can see the table layout idea is reflected one-to-one.
What has been added are (1) the colors for visually separating the main groups *resume* and *activities*, (2) the horizontal color shades for separating the second level groups *education/jobs* and *technical/creative/personal*, and (3) the vertical color shades for separating the level of detail (e.g. resume/education/degrees/B.Sc.,M.Sc.,Ph.D.).
The icons I have searched and downloaded via Google images and serve as placeholder for custom material later in the process.
Finally, here is some technical information about the prototype and its realization in HTML.
The files are organized into `icons`, `backgounds`, and the `dashboard.html` file.
The `icons` folder contains the transparent PNG icons downloaded form Google images.
The `backgrounds` folder contains semi-transparent black 1-pixel PNG images which are used as the different vertical and horizontal cell shades explained previously.
Finally, the `dashboard.html` file contains the implementation of the prototype in HTML/CSS.
[](./files.png)
[](./icons.png)
[](./backgrounds.png)
[](./html.png)
The purpose of this article was to explain the process how to get from a sketch to a prototype of your software application.
These types of processes are very common in software development.
Usually, you get some sort of fuzzy input (in this case the whiteboard sketch) and transform it into a more precise representation (the HTML code).
I hope you found it interesting to see this evolution happen to a concrete example.
In the future I hope to find similar stories to tell, as it is also an interesting process for me.
[](./process.png)
All the best.
---
### Personal Source Code Portal
- URL: https://hackenberg.tech/posts/2011_04_29_personal_source_code_portal/
- Date: 2011-04-28
- Tags: hyperkit-software, software-systems, web-development
- Summary: Since I have been asked for the code behind some articles, I decided to put online a separate website for public tracking and distributing the software projects...
The idea behind the **personal source code portal** is probably best explained along a few screenshots of the running system.
When entering the protal the user is presented with a so-called *dashboard*.
The goal of the dashboard is to provide the user with an overview of the available projects and their respective status.
Therefore the logo, the title and a short description of each project is displayed as well as the current version number from the file versioning system.

From the dashboard the user can select the project that he/she wants to know more about.
The project page is intended to provide access to all project-relevant resources such as screenshots, tutorials, activity feed, etc.
Moreover this should be the place where users can start getting involved e.g. by asking questions, helping others with solutions, or contributing to the source code and other project files.

Finally, the source code of the project can be accessed via a public read-only Subversion (SVN) repository.
The repository allows every user to easily download the software package through a SVN client such as TortoiseSVN.
Also you can stay up-to-date with bug fixes, new features, and latest versions in general.

I plan to extend the features of the source code portal on demand.
Certainly, one of the next steps will be to include feed support for distributing news into the network.
Also a discussion module should be available, probably similar to the one on my blog (which is easy to integrate).
---
### Research Group Seminar Winter 2011
- URL: https://hackenberg.tech/posts/2011_04_21_research_group_seminar_winter_2011/
- Date: 2011-04-20
- Tags: motion-capture, gesture-recognition, computer-vision, user-interface, slideshare-presentation
- Summary: Beginning of this week the research group I currently work at was going onto a two day seminar trip onto the country side south of Munich. Since we are a very l...
The event was situated in the [Seminar Hotel Jonathan](http://www.jonathan-seminarhotel.de), an establishment which focuses on providing a dedicated environment for learning and personal development.
Over two days my colleagues and I gave talks about their current research status in the field of software engineering.
In particular, many approaches focused on structured definition of software knowledge in the pre-programming stage.
For example, one of my colleagues presented a concept to derive software structures from knowledge about the application domain.
Hereby, the knowledge about the application domain is expressed in terms of simple statements such as "a bank customer withdraws money from his bank account".
Then entities like "bank, customer, account" and activities like "withdraw" are extracted and converted into executable steps.
My contribution to the seminar was a little off topic, as I was presenting the 3D multi-touch prototype which I previously introduced at [IEEE VR 2011](http://conferences.computer.org/vr/2011/).
Nevertheless it was an entertaining presentation and I could engage a little into discussions about the topic with my fellow colleagues.
To give you the chance to follow the topic and the discussion also outside the scope of our research group I posted the slides on [slideshare](http://www.slideshare.net/).
Feel free to comment about the presentation. `;-)`
---
### JavaScript Physics Simulation
- URL: https://hackenberg.tech/posts/2011_04_14_javascript_physics_simulation/
- Date: 2011-04-13
- Tags: data-visualization, hyperkit-software, javascript, simulation, youtube-video, zumida
- Summary: Some time ago I was testing the capabilities of JavaScript and vector graphics toolkits such as SVG (Mozilla Firefox, Opera, Safari) and VML (Microsoft Internet...
The YouTube video is meant to demonstrate the simulation prototype both in Mozilla Firefox and Microsoft Internet Explorer.
The two version differ a little in that Microsoft IE additionally display the velocity of each ball as well as collision debug information.
It is however possible to make both versions identical.
In terms of the logic behind the scenes there are two interesting cases to highlight:
(1) The ball bouncing back from the ground and (2) two balls colliding with each other.
The bounce logic first checks if the position of the ball and its radius cause a collision with the ground.
If that is the case then the velocity of the ball is reflected across the horizontal ground line and due to friction the amount is dampened.
This phenomena is depicted in the following picture series:


The behavior in case of collisions between two separate balls is a little more complex than that.
If two balls collide the connecting line between the centers of the balls (orange line in the following picture series) defines a local coordinate system.
Now the velocities of both balls have to be converted into this local coordinate system.
The reason is that this conversion reveals (1) the velocity component that is influenced by the collision and (2) the velocity component that is independent.
The first component is parallel to the orange line, the second component is orthogonal.
Next the influenced component is changed according to the laws of impulse, i.e. including the relative masses and velocities of the balls.
And finally the first and the second component have to be added again to obtain the new velocity of each ball.
The effect of this procedure is visualized in the following picture series.
Blue lines depict the components of the new velocities.


If I find the time I will also make sure to compile a package of the prototype for download.
So far it is just a bunch of files lying around on the hard disk.
In particular there are also dependencies on proprietary JavaScript libraries which have to be resolved properly.
Nevertheless I hope this is something of interest for you.
---
### Stick Figure Drawing Exercise
- URL: https://hackenberg.tech/posts/2011_03_27_stick_figure_drawing_exercise/
- Date: 2011-03-26
- Tags: drawing
- Summary: To improve my drawing skills recently I bought a book about stick figure drawing. Here is the result of my first exercise, but don't have too high expections ju...
The book suggests to start with a quick sketch of the figure.
This way you give your brain minimal chance to disrupt the creative process by starting to think about good and bad.
Then when you are satisfied with the result you can start elaborating your drawing with thicker and stronger lines.
To give your picture the final touch you finally can add colors and shading as well as motion effects.
The main two stages (drafting and elaborating) are shown in the following images:
[](./draft.png)
[](./final.png)
As tools I used a tablet PC and the open source software [MyPaint](http://mypaint.intilinux.com/).
This digital drawing toolset greatly facilitates the creative process:
(1) You can develop the draft quickly in the lowest layer of your canvas.
(2) You can add arbitrarily many virtual layers on top to elaborate the remaining parts of the picture.
I hope you like to follow my experiences with creative tools and processes.
It's great fun and I can only recommend it to anybody who is looking for ways to see the world with different eyes.
---
### IEEE VR 2011 in Singapore
- URL: https://hackenberg.tech/posts/2011_03_24_ieee_vr_2011_singapore/
- Date: 2011-03-23
- Tags: conference, slideshare-presentation, motion-capture, gesture-recognition, computer-vision, user-interface
- Summary: Last week I went to Singapore to present the results of my Master thesis at IEEE VR 2011, one of the world's most prestigeous virtual reality conferences. It wa...
[](./sands.jpg)
First I want to share some pictures of this amazing city.
The picture to the right shows the Marina Bay Sands, one of the newest and most impressive buildings in Singapore.
The remaining pictures are random impressions I collected when visiting the city.
From left to right you can see the following:
(1) A big statue in front of the SUNTEC, the international conference center where IEEE VR 2011 was held.
(2) Stairways inside the Esplanade, a modern art and exibition center with live music events.
(3) A palm way in front of the Marina Bay Sands, the building that you also see on the top.
[](./suntec.jpg)
[](./esplanade.jpg)
[](./palms.jpg)
And finally you can also view my presentation, which I held on the first day of the VR conference.
The talk was about the 3D multi-touch prototype that I developed during my Master thesis at Fraunhofer FIT:
A last word: if you ever get the chance to visit Singapore, take it, it's a great place!
---
### Pen Sketches with MyPaint
- URL: https://hackenberg.tech/posts/2011_03_10_pen_mypaint_sketches/
- Date: 2011-03-09
- Tags: drawing
- Summary: For a long time I have been searching for a sketching program to use with my Tablet PC Pen during the development of software systems. Recently I discovered a l...
It all started with drafting new versions of the RSS and mail logos, which can be found on the header of my blog:


Next a talk came into my mind when I was explaining a friend of mine the software architecture of my master thesis.
In this talk I used a similar visualization than the following to highlight the components:

While searching for further inspiration I picked random objects from my environment and imagination for the following to drawings:


And finally I drew my attention onto the visualization of humans respectively activities, which is useful during the development and marketing of many software systems:


Note that these are all digital drawings! Isn't that amazing?!
For the future I hope to create many more of these visualizations to share my ideas on informatics, computer science, and software development.
Maybe this naive and visual way of explanation is both interesting and entertaining even for a non-technical audience - very much as the photographies of outer space in the domain of physics/astronomy.
---
### Linear vs. Cubic Interpolation
- URL: https://hackenberg.tech/posts/2011_02_22_linear_vs_cubic_interpolation/
- Date: 2011-02-21
- Tags: youtube-video, data-visualization
- Summary: After talking with some non-computer scientists about my previous visualization of cubic interpolation I found out that the concept is difficult to understand i...
To give a short explanation: Again the red dots represent measured data points, for example temperature, lightness, air pressure, etc.
These measurements are distributed rather coarsly across the space, still we are interested in approximating values that lie inbetween.
Obviously this approximation has to be based in some way on the actual measurements that have been taken.
For example, linear interpolation assumes linear progression/degression between neighboring data points.
Instead, cubic interpolation assumes a more complex formula while allowing for smoother interpolation results.
In the end what you choose in your particular situation depends on many factors, i.e. even though being less impressive linear interpolation is used in a number of applications.
One important reason certainly is the complexity of the formulas and the complexity of computing results respectively.
Therefore you might think of the choice as a trade-off between quality and performance (although that might not be true for every case).
Still, with these articles I hope to encourage a discourse about information and computer science among a broader audience.
Also, comments are always welcome!
---
### Managing/Publishing Your Resume with PHP and XML
- URL: https://hackenberg.tech/posts/2012_02_14_online_xml_php_resume/
- Date: 2011-02-13
- Tags: blog, data-visualization, web-development
- Summary: For some time now I was looking for a solution to manage and publish my resume on my website. A simple solution is to upload the PDF, however integration with o...
First let's have a look at the data files.
The following two screenshots show (1) the folder structure for storing resume data and (2) one example of an XML file for the *study* section of the resume.
The folders devide the resume into four sections: awards, jobs, projects and studies.
Each of these sections contains folders for the respective entries.
Their folder names contain information about the start and end dates.
The date information is stored in the folder names so that the entries can be ordered by file name.
The XML files contain information relevant for each entry.
For example study entries store the institution, the location, the programme, the field, the degree, etc.
For now I have implemented a limited selection of information which may be extended if necessary.
[](./files.png)
[](./xml.png)
Now the great point about having resume data available in such XML format: You can build arbitrary visualizations for it.
For now I have worked on two variants: The tabular interface and the timeline interface.
The tabular interface immitates standard resume layouts.
Dates are printed to the left and information about the chapters of your life is given to the right.
[](./tabular.png)
A problem with the tabular layout is that temporal relations between e.g. study and job chapters are in many cases not explicit.
This is where the timeline layout tries to jump in: Each section (study, job, project, award) is given its own line and entries a placed on them with different colors.
To quickly understand the concept just have a look at the following screenshot.
[](./timeline.png)
I hope you liked the idea of having your resume back'ed by an XML data storage.
At least, having the data available now I will see where I can go in terms of visualization and interaction.
Maybe something nice and useful comes out!
---
### 3D Cubic Interpolation Video
- URL: https://hackenberg.tech/posts/2011_02_02_cubic_interpolation_demo/
- Date: 2011-02-01
- Tags: youtube-video, data-visualization
- Summary: Cubic interpolation is a popular technique in many branches of computer science. For example, it is used when having a time series of numbers and estimating the...
In the above visualization the colors of the 3D points have a specific meaning, which is explained in the following table:
| Color | Description | Example |
| :--- | :--- | :--- |
| Red | Measured data point | Measured brightness of pixel `(x,y)` in a digital image |
| Green | Interpolated data point along one axis | Estimated brightness between pixel `(x,y)` and `(x+1,y)` Note the change only along the `x` dimension! |
| Blue | Interpolated data point along two axes | Estimated brightness between pixel `(x,y)` and `(x+1,y+1)` Note the change both along the `x` and the `y` dimension! |
The math behind the visualiuation is explained in the Wikipedia articles [Cubic interpolation](http://en.wikipedia.org/wiki/Cubic_interpolation) and [Bicubic interpolation](http://en.wikipedia.org/wiki/Bicubic_interpolation).
The concept of *bicubic interpolation* hereby refers to problems with two input variables, such as the `x` and `y` dimensions in the above example.
In these cases the basic cubic interpolation method is applied two times in a row, first along the `x` dimension using measured samples, then along the `y` dimension using the previously obtained estimates.
The details of this procedure a well explained in the corresponding Wikipedia entries.
What you should probably take from this article are two things:
(1) a visual understanding of cubic interpolation and (2) a feeling for when this method is applicable.
Also, if questions are open please do not hesitate to ask, and I will try to make my best to eliminate all certainties `;)`.
---
### 3D Multi-Touch Product Vision
- URL: https://hackenberg.tech/posts/2011_01_27_3dmt_product_vision/
- Date: 2011-01-26
- Tags: drawing, motion-capture, gesture-recognition, computer-vision, user-interface
- Summary: As you might know I was developing a prototype for 3D multi-touch interaction during my Master thesis at Fraunhofer FIT. Lately I had the chance to talk with a ...
[](./pencil_drawing.jpg)
All in all the setting is inspired by Osca's profession: **Drawing**.
However, we not only had *artistic* but also *technical drawings* in mind, i.e. a mixture of Photoshop style and CAD style applications.
Thereby, we see major benefits of a digital drawing table in:
(1) the flexibility of a digital system,
(2) the integration with world-wide networks,
and (3) the potential for usability improvements due to 3D interaction around large high-resolution screens.
Moreover, the screen surface could also serve as a light talbe (commonly used for animations) and as a regular paper drawing table.
Current elements of the digital drawing table are:
(1) a 3D LED TV, which allows to deliver true 3D impressions of digital content and media.
(2) a tool and control panel on the bottom of the digital drawing surface, which provides access to generic and application-dependent widgets and pens.
(3) a set of cameras mounted on the edges of the digital drawing surface, which cover the interaction space and track user movements.
(4) a handling similar to paper-based counterparts as for example producted by [Bieffe](http://www.bieffe.it).
How far we can go with that vision time will show.
But I truely believe that future work spaces in many professions will have similarly complex digital high-tech components due to their Cameleon-abilities and networked integration with society.
At last it is left to say that if you like the idea and you are interested in contributing do not hesitate to contact me!
Brilliant tools are always a product of social interaction in many ways!
---
### Improved Website Usability!
- URL: https://hackenberg.tech/posts/2011_01_19_website_usability_redesign/
- Date: 2011-01-18
- Tags: blog, human-computer-interaction, user-interface, ux-design
- Summary: After being online with the original layout and navigation concept for almost two years it was time for some central improvements. Among others the RSS feeds ha...
Secondly, the index page has be redesigned with the goal to provide a better overview of the blog articles in the individual categories.
Following this critical usability issue the article categories have been redefined to reflect better the underlying information characteristics.
In particular, articles are now devided into (1) global information about the IT industry, (2) personal information about projects and activities, and (3) website related annoucements.
I hope you like the changes and feel that the website has improved in terms of readability and browsability.
Also, suggestions are always welcome, after all this blog is also just a prototype and playground for trying and elaborating on ideas.
---
### Effective Task Management with Whiteboard and Stickers
- URL: https://hackenberg.tech/posts/2012_01_11_whiteboard_task_management/
- Date: 2011-01-10
- Tags: task-management, hyperkit-software
- Summary: At my new job alongside their PhD thesis everybody is involved in a number of research projects both public funded and with industry cooperation. In many situat...
A whiteboard and strickers are the key.
The first step is to dedicate some part of your whiteboard to task management.
Then divide the part into three areas: (1) Pending tasks, (2) working tasks and (3) closing tasks.
Finally write your tasks on stickers an pin them into the respective areas.
Additionally I use color markers to indicate projects and other activity lines.
It helps me to order the tasks mentally.
[](./photo.jpg)
Whatever task management technique you choose, I believe key factors are simplicity and flexibility.
Simplicity means reduced overhead to organize your tasks.
Flexibility means being prepared for most situations.
Both factors lead to an effective technique.
In particular, this holds for my current work environment and probably for many others as well.
---
### Master Thesis Video.
- URL: https://hackenberg.tech/posts/2010_06_27_master_thesis_video/
- Date: 2010-06-26
- Tags: youtube-video, motion-capture, gesture-recognition, computer-vision, user-interface
- Summary: After finally completing my Master Thesis project at Fraunhofer FIT me and some friends took some time to prepare a demonstration video. The video is now availa...
As a short introduction: During my Master Thesis I worked on barehanded human-computer interaction in 3D.
More figuratively speaking I was working on enabling the user to manipulate virtual 3D content using barehand motion and gestures.
The resulting system has shown to be quite responsive, however it is certainly still in prototyping stage.
Personally I believe that at most one year development is required to fix the major stability issues.
Then another year might be required to develop more robust and flexible gestures.
Now enough talking! Here is the video, enjoy:
I hope you liked the demonstration.
If your interest is awakened feel free to contact me and ask any questions (even stupid ones `;)`).
In an upcoming series of blog posts I might also explain the technical details of the system, if there is the demand for that.
---
### Ajax/PHP Distributed Event Bus.
- URL: https://hackenberg.tech/posts/2010_01_05_ajax_php_distributed_event_bus/
- Date: 2010-01-04
- Tags: hyperkit-software, javascript, software-systems, web-development, youtube-video
- Summary: How to synchronize the users of your web site or web application? How to propagate events from one browser or client to the next? This article demonstrates a fi...
The solution for user synchronization and event propagation is a so-called distributed event bus.
The idea of this bus is, to provide a component where several clients can connect for publishing and recieving events.
The component guarantees that any event propagated will also be recieved by all clients interested.
Similar techniques have already been used for implementing Google's [GMail](http://mail.google.com) and [Wave](http://wave.google.com) applications.
These use the distributed event bus for notifying the user of new emails, chats and much more.
To get started with my simple prototype, I posted a video on [YouTube](http://www.youtube.com) which demonstrates the basic capabilities of the system.
In the demo, I use two browsers for accessing the distributed event bus.
This simulates the use case where two independent clients log in from possibly varying locations.
Now, let's understand how the implementation of this simple prototype works.
Therefore, I prepared a figure illustrating the architectural structure of the system.
The main decompostion is done by *client* and *server*, each refering to the web browser and the web server respectively.
Both comunicate via the *HTTP* protocol, which is the standard protocol for web content retrieval.
This protocol is also used by *AJAX* for reloading page fragments from the server or uploading content from the client without the need of reloading the entire page.
Finally, for each entity the individual subcomponents are depicted which I will discuss later.
[](./architecture.png)
Now, let's have a look at each subcomponent in isolation.
From this presentation I hope to give the best possible insight into the system.
If you have further questions, do not hesitate to send me a message or comment on this article.
The **channel** is the heart of the system.
It is stored on the server and basically denotes a regular XML file storing all events in a circular log file fashion.
*Circular log file* means, that only a maximum number of entries is stored.
If this limit is reached, the oldest entries are being deleted saving space for new ones.
This is an effective method for saving hard disk memory on your system which is also used by many other applications and software packages like *DB2*.
The format of the log file is defined as follows:
```xml
Hello World!
```
At its root, a `channel` element is defined which holds a possibly infinite number of `item` elements.
The items store the actual events that have occured during system operation.
Each item provides information about the time, client, type and content of the event.
The time is given in timestamp format, i.e. the elapsed number of seconds since January 1, 1970.
The client currently stores a randomly generated ID, which is assigned to each web browser instance upon page entrance.
The event type and content are arbitrary, i.e. they can be tailored to any specific need like transmitting login events, keypress events or higher level activities.
The other two server-side components are the **publish** and **update** script.
The first takes care of inserting new `item` elements into the channel.
The event information is passed using *HTTP GET* and *HTTP POST* requests.
The second takes care of retrieving updated event information from the channel.
Therefore, the last timestamp seen by the client is passed as an *HTTP GET* parameter.
Each more recent item is delivered by the script in the same format as defined by the **channel** data structure.
For concurrency reasons, both scripts first acquire a lock for the file before reading or writing its contents.
This simple filesystem based synchronization method works well in the PHP domain.
Finally, the client-side components are left for discussion.
The core of the client deployment is a general *JavaScript API* which allows to connect to channels, register event handlers and publish events.
### Event Dispatching and Publishing
Every browser instance generates a random client ID upon entry. When an event is dispatched or published, HTTP POST sends the payload to `post.php`:
```javascript
var client = Math.round(Math.random() * 1000000);
var handlers = new Object();
function HandleEvent(timestamp, microseconds, client, type, content) {
if (handlers[type]) {
for (var i = 0; i < handlers[type].length; i++) {
handlers[type][i](timestamp, microseconds, client, type, content);
}
}
}
function Publish(type, content) {
var body = "client=" + client + "&type=" + encodeURIComponent(type) + "&content=" + encodeURIComponent(content);
var post = new XMLHttpRequest();
post.open("POST", "post.php");
post.setRequestHeader("Content-type", "application/x-www-form-urlencoded");
post.send(body);
}
```
### Long-Polling Connection Loop
The `Connect` function initiates long-polling against `channel.php`. As soon as the server closes the response stream after a timeout or new events, it recursively reconnects using the latest timestamps:
```javascript
function Connect(timestamp, microseconds) {
var channel = new XMLHttpRequest();
channel.onreadystatechange = function() {
if (channel.readyState == 4) {
Update(channel.responseText);
Connect(last_timestamp, last_microseconds);
}
};
channel.open("GET", "channel.php?timestamp=" + timestamp + "µseconds=" + microseconds);
channel.send(null);
}
```
### Event Handler Registry
Clients register callbacks for distinct event types without coupling components together:
```javascript
function Register(type, handler) {
if (!handlers[type]) {
handlers[type] = new Array();
}
handlers[type].push(handler);
}
function Unregister(type, handler) {
if (handlers[type]) {
var index = handlers[type].indexOf(handler);
if (index != -1) {
handlers[type].splice(index, 1);
}
}
}
```
## Client Application Example
To demonstrate the API, we wire an HTML chat interface to the distributed event bus:
```javascript
function Say(form) {
Publish("message", form.content.value);
form.content.value = "";
}
function UpdateMessageList(timestamp, microseconds, client, type, content) {
var messageList = document.getElementById("messages");
var messageItem = document.createElement("li");
messageItem.appendChild(document.createTextNode(content));
messageList.appendChild(messageItem);
}
Register("message", UpdateMessageList);
Connect(timestamp, microseconds);
```
First, the method `Say` publishes an event of type `message` from the form input.
Next, the `UpdateMessageList` event handler is registered with the event bus. When any client sends a message, all connected clients receive the notification and append it to their UI.
## Server-Side Implementation
The backend is driven by two lightweight PHP scripts that manage the file-based circular queue with filesystem locks.
### Long-Polling Event Consumer (channel.php)
The consumer script holds open an HTTP connection for up to 25 seconds, querying `channel.xml` with a shared read lock (`LOCK_SH`):
```php
item as $item) {
if ((int) $item['timestamp'] > $timestamp) {
print($item->asXML());
flush();
$timestamp = (int) $item['timestamp'];
}
}
usleep(20000);
}
?>
```
### Event Ingestion & Circular Queue Pruning (post.php)
When a client submits an event, `post.php` acquires an exclusive lock (`LOCK_EX`), appends the new ``, and automatically removes items older than 10 seconds to maintain a fixed file size:
```php
addChild("item");
$item['timestamp'] = time();
$item['client'] = $_POST['client'];
$item['type'] = $_POST['type'];
$item->content = $_POST['content'];
$dom = dom_import_simplexml($channel);
foreach ($channel->item as $entry) {
if ((int) $entry['timestamp'] < time() - 10) {
// Evict items older than 10 seconds
$dom->removeChild($dom->firstChild);
} else {
break;
}
}
$dom->ownerDocument->save("channel.xml");
while (!flock($lock, LOCK_UN)) {
// Release write lock
}
?>
```
I hope you enjoyed the demonstration of this sweet little piece of technology.
If you have further questions or want to play with the code, just drop me a line.
---
### XML Template Engine using PHP.
- URL: https://hackenberg.tech/posts/2010_01_04_php_xml_template_engine/
- Date: 2010-01-03
- Tags: hyperkit-software, software-systems, web-development
- Summary: After the success of JSP and JSP tag libraries in the Java world, I was searching for a similar mechanism in PHP. Since the search was not successful and I shar...
In this article I demonstrate how to use the engine for developing a simple page template for regular websites.
Then I show how to extend the functionality of the system using the proprietary interface specification (which is not final at the current stage).
To get started, let's first have a look at a simple sample template which has been developed for testing the first engine prototype.
Notice, that some code fragments use a new content management framework which I will dedicate an own article later this year.
[](./sample.png)
The first thing that springs into the eye is, that we are generating regular HTML content with this template by means of the root element `html`.
The element also hosts a namespace definition which provides the link with the templating mechanism: `xmlns:code`.
The so-called namespace URI, i.e. the value of the namespace attribute, uses the prefix `php:` which tells the engine that elements of this namespace will be routed through the given class.
In our case, we are referring to a general `Tags` class which I intend to ship with the final system.
When running the template engine with the given template definition, all nodes will be copied from the source to the target document except the `code` elements.
Each `code:...` will be translated into a static function call on the `Tags` class.
The convention is that a `code:name` will be converted into the method name `Tags:processName` where the first letter of the tagname is capitalized.
The following figure shows the interface of the current `Tags` class:
[](./tags.png)
First, let's discuss the function signatures which are the same in all cases.
Each function retrieves a pointer to the target document for creating nodes and other `DOM`-related tasks.
Additionally, a reference to the current parent node in the target document is passed for appending new content.
The actual template node that was responsible for triggering the call can be access via the `node` parameter.
A reference to this node is necessary, e.g. for accessing the attributes and children of the node.
As an example, most functions use the attribute `expression` for evaluating some PHP code and processing the result.
Finally, a the arrays `parameters` and `variables` are provided in the current implementation.
These are meant to host named objects either scoped in the `parameter`'s case and global in the `variable`'s case.
They are for example used to pass parameters to the template when starting the execution.
The last thing you should notice is the `Template::processChildren` call.
The class `Template` provides the basic implementation of the template engine.
It offers `process` methods for traversing the template `DOM` tree, copying contents to the target document and calling extensions.
This also means, that tags which allow nested content should direct control back to the `Template` class at some point.
This is for example done in case of the `code:if` tag respectively `Tags::processIf` static method.
The method starts traversing the content if and only if the value of the `expression` script returned something `true`.
The language you can use in all `expression` attributes is PHP.
This is a nice advantage over related approaches where different languages are used for implementation, scripting, etc.
I hope, you liked the demonstration.
If you need the code for testing the system please let me know.
I am willing to email you if you ask nicely `:)`.
---
### Master Thesis Screenshots!
- URL: https://hackenberg.tech/posts/2009_11_17_master_thesis_screenshots/
- Date: 2009-11-10
- Tags: motion-capture, computer-vision, data-visualization
- Summary: Get ready for the newest and freshest screenshots of my 3D hand tracking application. These pictures show some results of my six month work at Fraunhofer Insitu...
I have prepared two screenshots for you, both showing the live view of my *visual workbench* application.
The live view directly processes the video stream delivered by the USB camera, calculates the hand position and draws the results.
I use [wxWidgets](http://www.wxwidgets.org) and [OpenCV](http://opencv.willowgarage.com/) as third-party, open source dependencies.
The first screenshot shows the *default view* (on the top of the screen), the *skeleton view* (on the bottom of the screen) and the *memory statistics view* (on the right of the screen).
[](./default.jpg)
In the second screenshot, the *default view* is replaced by the *fast view*.
Read the paper to understand the difference `;)`.
[](./fast.jpg)
I hope you enjoyed the demonstration.
Stay tuned for new results in the coming months!
E.g. we are building a 3D web browser prototype for evaluating gestural interaction.
---
### Algorithm Debugging using OpenGL.
- URL: https://hackenberg.tech/posts/2009_07_21_opengl_debugging_grid_3d/
- Date: 2009-07-20
- Tags: data-visualization, computer-vision
- Summary: Currently, I am working on my thesis in the area of Computer Vision. The algorithms are quite complex and difficult to debug. Therefore, I implemented a simple ...
First I want to give you an impression on how the debugger looks like.
The following screenshot shows the debugger setup for an applications which captures video streams from two connected USB cameras:
[](./single.png)
The grid cells to the left show the original images captured from the video devices.
The next column shows the edge images for the original images, i.e. image data is reduced to locations where high color differences are found.
The final three columns show different types of histograms over the image data.
First, 1D histograms are calculated counting the intensity of colors in the images.
The 2D histograms show counts of normalized colors, i.e. the brightness of the pixels is factorized.
Finally, the 3D histograms to the right show counts of the individual colors of the RGB color space.
Each color is represented as a sphere.
The sphere is scaled according to the relative frequency of the respective color compared to the total number of pixels.
The example demonstrates different types of debuggers which I implemented for my master thesis.
Generally, debuggers have to inherit from the abstract base class `Debugger`.
The interface is shown in the following figure:
[](./interface.png)
Basically, only a single virtual function has to be implemented: `draw`.
The function `draw` takes one argument, the side length of the cube which it renders to.
The task of the function is to render OpenGL primitives to the cube which is centered at `(0,0,0)`.
The framework takes care of moving the rendered content to the correct grid position.
Different types of debuggers my render very different contents to the cube, such as textured quads or colored spheres.
The content mainly depends on your application's requirements.
Finally, instances of the `Debugger` objects have to be added to the `screen`.
The `screen` provides a data structure for storing the debuggging grid and rendering the components.
The following figure shows how to add fill the screen:
[](./setup.png)
Here, I use a loop for adding different layers of `Debugger` objects by alternating the `z`-coordinate.
For each debugger, the `x`, `y` and `z` coordinates of the target cell have to be specified.
There is no limitation for the values, i.e. the backend datastructure automatically scales to the given values.
Cells, for which no entry is given are left blank during rendering.
Finally, let's see what happens when we render five layers of the given debugger setup.
The result is given in the following screenshot:
[](./multiple.png)
As you can see, the cells are replicated along the `z`-axis.
Alternatively, different types of debuggers could have been placed instead, i.e. my test case is a bit arbitrary.
But, the basic functionality of the system should be well demonstrated by now.
I hope, you like the idea and see potential for applying the framework in your applications.
I would also be happy to get feedback on how to improve or extend the system.
Have a great day!
---
### JavaScript Graph Layout using SVG.
- URL: https://hackenberg.tech/posts/2009_07_11_javascript_graph_layout_using_svg/
- Date: 2009-07-10
- Tags: data-visualization, hyperkit-software, javascript, knowledge-graphs, zumida
- Summary: Nowadays, it is not a simple task to integrate interactive graphs into Web applications. Graphs could be used in various ways from presenting overviews to prese...
The current prototype is restricted to use with SVG-enabled browsers such as *Mozilla Firefox* or *Opera*.
I decided to use SVG to draw circles and lines which provides a much richer visual presentation of graphs.
The original prototype used HTML `div` elements and didn't draw edges between the nodes.
The following picture is an example graph rendered with the engine:
[](./svg.png)
The nodes are represented as red circles.
Each node is identified by a numbered label.
Edges are drawn as dashed lines.
The numbers on the edges represent the deviation of the edge length from the optimal edge length.
The optimal edge length can be defined by the user.
This way, the user can specify, how much the graph structure is extended or contracted.
Now, let's have a look, how the graph is specified in the backend.
Currently, there is a simple functional API for creating and linking nodes as well as starting the layout algorithm.
### Graph Definition and Topology Setup
Nodes are instantiated as SVG circles, and links are established with target optimal distances:
```javascript
// Create 7 graph nodes
for (var i = 0; i < 7; i++) {
createNode();
}
// Connect nodes with target edge lengths
linkNodes(0, 1, 430 / 4);
linkNodes(0, 2, 450 / 4);
linkNodes(0, 3, 800 / 4);
linkNodes(1, 2, 260 / 4);
linkNodes(1, 3, 420 / 4);
linkNodes(1, 5, 1000 / 4);
linkNodes(2, 3, 400 / 4);
linkNodes(2, 4, 720 / 4);
linkNodes(3, 4, 480 / 4);
linkNodes(3, 5, 640 / 4);
linkNodes(3, 6, 850 / 4);
linkNodes(4, 5, 670 / 4);
linkNodes(4, 6, 580 / 4);
linkNodes(5, 6, 470 / 4);
startAlgorithm();
```
The calls to the method `createNode` add a node item to the internal data structures and return a node identifier.
The calls to the method `linkNodes` add edges to the internal data structures for the two nodes specified in the first two arguments.
The third argument is the optimal edge length, allowing the user to specify how much the graph structure extends or contracts.
## Force-Directed Layout Implementation
The layout engine uses spring-electrical force dynamics to iteratively move nodes toward their equilibrium states.
### Simulation Configuration
The engine configures damping, step sizes, and canvas boundaries:
```javascript
var stepsize = 0.25; // Percentage of the force sum applied per step
var randomsize = 0; // Random perturbation size in pixels
var width = 800; // Width of the SVG canvas
var height = 600; // Height of the SVG canvas
var move_threshold = 1; // Percentage of nodes active per step
var edge_threshold = 1; // Percentage of edges evaluated per step
```
### Accumulating Spring Forces
In each iteration, the engine computes the distance vector between linked nodes and accumulates attraction or repulsion forces based on deviations from the target edge length:
```javascript
for (var j = 0; j < nodes.length; j++) {
if (Math.random() < edge_threshold && weights[i] && weights[i][j]) {
var diffx = posx[j] - posx[i];
var diffy = posy[j] - posy[i];
var distance = Math.sqrt(diffx * diffx + diffy * diffy);
var length = distance - weights[i][j];
// Accumulate directional force vector
updatex[i] += (length * diffx) / distance;
updatey[i] += (length * diffy) / distance;
}
}
```
### Updating Node Positions and SVG Coordinates
Finally, the displacement vectors are damped by `stepsize` and applied directly to the SVG circle elements:
```javascript
for (var i = 0; i < nodes.length; i++) {
posx[i] += updatex[i] * stepsize + ((Math.random() - 0.5) * factors[i]);
posy[i] += updatey[i] * stepsize + ((Math.random() - 0.5) * factors[i]);
// Synchronize SVG DOM attributes
nodes[i].setAttribute("cx", posx[i] + "px");
nodes[i].setAttribute("cy", posy[i] + "px");
}
iteration_step++;
updateMetaData();
```
Soon, I plan to extend this framework for non-SVG enabled browsers.
Also the API needs some refactoring.
An object-oriented design might be more suited, to even support multiple graphs on a single page and simple AJAX support.
I hope you like the idea for this toolkit.
Give me some feedback!
---
### HyperKit - A lightweight CMS written in PHP.
- URL: https://hackenberg.tech/posts/2009_05_30_hyperkit_leightweight_cms_php/
- Date: 2009-05-29
- Tags: hyperkit-software, software-systems, user-interface, web-development
- Summary: Recently, I helped a friend of mine who is starting his own business with his website. I searched for a lightweight content management system which provides eno...
Content management has been a topic for several years now.
I remember working with my first CMS when I was 18.
Back then, I was working for a marketing agency in my local town.
We were using *Typo3*, which is a huge and powerful system, but also a big pain in the ass! `:)`
The worst about Type3 was the fact, that you had to use a proprietary language for coding templates, called *TypoScript*.
Also, the editor for coding the scripts was a simple HTML `textarea`, which prevented the developer from using proper intendation for making the code readable.
Maybe, nowadays these drawbacks have changed, but still I believe the system is too big for using it for certain businesses.
Additionally, the developer has to deal with complicated modules for extending the system functionality, which makes it even worse.
Other projects go the exact opposite way: They try to provide a minimal system for making development as easy as possible.
As an example I want to mention [CMS from Scratch](http://cmsfromscratch.com/).
I installed the system and started implementing my friends website.
It was really easy to use and the design was coded after a few minutes.
But then it came to extending the functionality for providing picture galleries and other content modules.
There, the drawbacks of the system revield, as it was not obvious to me how to implement that.
Finally, I decided to design and implement my own concept: *HyperKit*.
The basic idea of HyperKit is, to make organize all the content entered by the web developer in *collections* (or *content modules*).
I.e. there are collections for the HTML pages themselves, for images, for blog articles and for anything else you can imagine.
When installed from scratch, HyperKit does not provide any collection except the **Setup collection**.
Each content added to the setup collection is transformed into a collection on it's own.
To illustrate this, I have taken a screenshot from the official [HyperKit website](http://www.hyperkit-software.com) backend.
[](./setup.jpg)
The screen shows the HyperKit backend.
The user currently opened the setup collection.
The setup collection contains as first element the *page collection*.
The second collection is the *fragments collection* which contains reusable HTML/PHP snippets such as the page header and the page footer.
As you can see on the left hand side, these collections are also accessible via the navigation column.
From there, the actual contents of the collections can be edited.
E.g. for the *pages collection*, the user can start editing the HTML pages, define titles, labels, descriptions and much more.
Actually, the fields which are available are determined by an XML configuration file.
In a later article, I will explain the technical aspects in greater detail.
For now, you can have a look at the offical project page under [http://www.hyperkit-software.com](http://www.hyperkit-software.com).
I hope to get feedback for the system.
Maybe it can grow into a mature toolkit for web developers in the near future!
---
### Diverse Logo Ideas.
- URL: https://hackenberg.tech/posts/2009_04_06_diverse_logo_ideas/
- Date: 2009-04-05
- Tags: drawing
- Summary: Since I haven't published any article for a while, I thought it would be a good idea to get some new work impressions out. Here are some logos I developed over ...
The logos are developed using open source software such as [Gimp](http://www.gimp.org) and [Inkscape](http://www.inkscape.org).
For some I used my *Wacom Bamboo* which is a great tool for drafting and creative work.
The first logo was for a chair at the *RWTH Aachen* called *Mobnets*.
They are concerned with mobile and wireless technologies.
[](./mobnets.png)
The next logo I developed during my traineeship at [Siemens Corporate Research](http://www.scr.siemens.com).
It was intended to be used for a collaboration platform in medical research.
[](./sciport.png)
The next logo I sketched for a small project of mine called *RIDE*.
As soon as I have something good to demonstrate, I will post an entire article on the project.
[](./ride.jpg)
Finally, here's a very first draft about another idea with the name *edu ride*.
I created it during a branding brainstorming session.
[](./eduride.png)
What I've learned during my work is that sketching with *Wacom Bamboo* and implementation with vector graphics works best for me.
Also the mentioned open source tools are really sufficient, to implement most of my ideas.
The only drawback I experienced was stability of *Inkscape*, but that was some time ago and should be fixed now.
I hope you liked the impressions. Give me some feedback if you like. Have a nice day!
---
### Augmented Reality Framework Screenshot.
- URL: https://hackenberg.tech/posts/2009_03_24_augmented_reality_framework_screenshots/
- Date: 2009-03-23
- Tags: computer-vision, data-visualization
- Summary: Last year I started developing an augmented reality framework with a friend of mine from electrical engineering science. We succeeded in providing a QT user int...
Here is a screenshot where we apply different image processing steps sequentially and display each of the intermediate frame buffers for comparison:
[](./screenshot.png)
As next steps we planned to extract straight lines from the image for detecting the square marker shapes.
This term I participated in the lecture *Computer Vision* held by *Prof. Bastian Leibe*.
So my knowledge about this area has increased since quite a bit.
---
### JavaScript 3D Engine Screenshots.
- URL: https://hackenberg.tech/posts/2009_03_24_js_3d_engine_screenshots/
- Date: 2009-03-23
- Tags: computer-graphics, data-visualization, hyperkit-software, javascript, zumida
- Summary: The history of me developing 3D engines for the Web goes back quite a while. It was revived after working at Siemens Corporate Research because they had the nee...
I tested the system on different browsers.
Sadly, Internet Explorer does not provide native SVG support.
But with the new HTML 5 standard things might change due to the *canvas* element.
Here are sample screenshots from Firefox and Opera browsers (note that other browsers such as Microsoft Internet Explorer, Safari, and Opera are supported in principle as well):


In this example real-time rotation was realized.
Maybe, in a more comprehensive article I will present the techniques and some performance evaluations.
---
### Business Documents using XSL-FO.
- URL: https://hackenberg.tech/posts/2009_03_21_business_documents_using_xsl_fo/
- Date: 2009-03-20
- Tags: hyperkit-software, software-systems
- Summary: Recently I faced the problem of writing a bill to a customer for which I did Web consulting and development services. I searched for a solution to automatically...
First, let's have a look what *XSL-FO* actually is:
XSL-FO is an XML-based language for type setting, i.e. for describing textual documents.
It is quite similar to HTML in specifying *margins* and *font properties*.
In a sense it is comparable to *Latex* as well because it is usually compiled into *PDF format* using a command line processor (though of course *Latex* is much more powerful especially because of its vast amount of styles and commands available).
If you want to know more about *XSL-FO* I refer you to the tutorial offer by [w3schools](http://www.w3schools.com/xslfo/default.asp).
That's at least where I learned how to use it.
Additionally, you should have a look at the *XSL-FO processor* offered by the [Apache Foundation](http://xmlgraphics.apache.org/fop/).
It provides an easy to use command line tool, which can be used to convert *XSL-FO documents* into *PDF format*.
Moreover, it not only provides direct XSL-FO input, but also normal XML plus an *XSL stylesheet*.
The *XSL stylesheet* is used to transform the original XML document into XSL-FO format.
That's also the final setup, I chose to use.
The following figure depicts the components graphically:
[](./system.png)
As input I provide an *XML document* which contains the data of the business document and the *XSL stylesheet* which takes care about the layout.
I'll demonstrate this setup using an example bill.
## Data Modeling: The XML Invoice Structure
The primary benefit of this architecture is the strict decoupling between structured business data and presentation layout.
The source XML document holds the invoice metadata, client address, and individual line items without any styling information:
```xml
01.01.2010101.12.200923.12.2009BertaMusterMusterdorfMusterwegXBeratung150.00Umsetzung1100.00
```
In the XML document we specify some meta-information such as the *date* and the *service period*.
Then we give information about the *recipient* and the *items*.
Notice, that this XML format is not standardized.
It suites very well my purpose, but can be changed according to personal preference.
## Master Template: Letter.xsl
To avoid duplicating corporate letterheads, margins, and sender information across different types of business documents (e.g., invoices, offers, delivery notes), we establish a shared base stylesheet `Letter.xsl`.
### Page Geometry and Regions
The master stylesheet sets up the physical A4 page dimensions, margins, and defines the header (`xsl-region-before`), body (`xsl-region-body`), and footer (`xsl-region-after`):
```xml
```
### Static Header and Footer Blocks
The header and footer are placed inside `fo:static-content` containers, ensuring they repeat across all pages. The footer includes structured contact details and bank connection data positioned with absolute side-by-side containers:
```xml
KontaktpersonName: Hans MusterMobil: +49 (xxx) yyy yyy yy yyE-Mail: kontakt@hans-muster.deBankverbindungKontoinhaber: Hans MusterKontonummer: xxx xxx xxBankleitzahl: yyy yyy yy
```
### Dynamic Recipient Addressing
The recipient template extracts the dynamic customer data passed into the stylesheet, applying conditional salutations based on gender attributes:
```xml
Hans Muster, Musterstrasse XX, YYYYY MusterstadtFrau Herr -
```
## Invoice Transformation: Bill.xsl
Now, we define the concrete invoice template `Bill.xsl`. It inherits the master letterhead layout while focusing purely on bill-specific components.
### Template Import and Parameter Binding
The invoice stylesheet begins by importing `Letter.xsl` and binding the document's `` node to the parameter expected by the parent template:
```xml
```
### Invoice Metadata Header
Inside the main ``, we render the invoice title, invoice number, issue date, and service period into a clean two-column metadata block:
```xml
Rechnungsnummer: Rechnungsdatum: Leistungszeitraum: - Rechnung
```
### Dynamic Items Table with Alternating Row Colors
To display the invoiced positions clearly, we build an `fo:table` with proportional column widths and alternate the background color of each table row using the modulo operator `position() mod 2`:
```xml
#e0e0e0whitex
```
### Recursive Total Cost Calculation
Because XSLT 1.0 is a purely functional transformation language without mutable accumulator variables, computing the invoice grand total requires a recursive template that traverses sibling nodes (`following-sibling::entry`):
```xml
0
```
## Summary and Lessons Learned
Developing business documents using XML and XSL-FO provides a clean, robust separation between business data and layout.
By isolating corporate letterhead definitions in `Letter.xsl` and document-specific structures in `Bill.xsl`, new document types can be introduced rapidly.
While Apache FOP provides an effective automated pipeline for document generation, integrating complex vector graphics can occasionally pose challenges. For highly mathematical or typesetting-heavy requirements, generating LaTeX source from XML is a powerful alternative, while XSL-FO remains an excellent solution for standard corporate business workflows.
---
### XML-RPC based Spam Filtering.
- URL: https://hackenberg.tech/posts/2009_03_20_xml_rpc_based_spam_filtering/
- Date: 2009-03-19
- Tags: blog, software-systems, web-development
- Summary: To prevent my blog from being spammed, I recently integrated a spam filtering service. The service is offered by blogspam (dot) net, it's entirely open source a...
You might wonder, why I decided to implement my own XML-RPC HTTP client, because there are already packages out there which solve that problem.
Well of course, first of all I like doing stuff my self (such as implementing my own blog `:)`).
But also I was really considering to use an available package for doing that.
Sadly, Ubuntu only provides a very basic XML-RPC module for PHP5 called `php5-xmlrpc`.
The project homepage can be found on [xmlrpc](http://xmlrpc-epi.sourceforge.net/).
This is also the package I used in my final implementation for the simlicity of installing it with `aptitude`.
A more advanced library is offered by [phpxmlrpc](http://phpxmlrpc.sourceforge.net/) which I didn't bother with trying to install.
In general cases I would recommend using the second, as the API seems to be quite comprehensive.
So now, what's offered by `xmlrpc-epi`:
First of all, you can use it to develop your own XML-RPC services.
This is quite nice, but it's not at all what I wanna do.
Second, it provides methods for generating XML-RPC fragments which can be passed via HTTP to invoke remote services.
Here is an example:
[](./php_encode.png)
In the previous figure, I show how to generate an XML-RPC request to a method called `testComment`.
This method expects the parameters `ip` for the IP of the user posting the comment, `email` for the email address provided by the user, `name` for the name entered by the user and `comment` for the comment content posted.
The function call `xmlrpc_encode_request` will generate the following XML fragment:
[](./xml_rpc_request.png)
The XML format is specified by the XML-RPC standard.
The recipient can use it to derive which method to call and which parameters to pass.
For the parameters he can easily find out which type was used on the client side.
Now the only thing which is left is to send this fragment via `HTTP POST` to the service and parse the response.
As this is not provided by the XML-RPC library I use, I have to implement this part my self.
For sending HTTP requests I use the method `fsockopen` which is provided by PHP to open network connections.
Then I construct the HTTP message which should be sent and write it to the socket.
Here is the corresponding code fragment:
[](./http_post.png)
So what's happening is that first the socket is opened to the host `test.blogspam.net` on port `8888`
Then the HTTP request is sent.
The request specifies the resource `/` in `POST` mode and some other header parameters.
After writing the request this will cause the web service to immediately write the response to the socket and close the stream.
Now we have to read and parse the response for getting the answer by the service.
First let's get the bytes from the stream:
[](./read_socket.png)
We read from the stream until the end of the stream is reached, i.e. no byte data is left.
Then we close the socket and free all resources.
So here is what the HTTP response looks like:
[](./http_response.png)
The response contains the usual HTTP header and the response body.
The header gives information about the HTTP status and other header variables such as `Content-Length` or `Content-Type`.
The body contains the value returned by the method `testComment` (which is the method we envoked in our request) encoded in XML.
In this example we see that the comment was classified as *spam* because the IP does not seem to be valid.
In the case of a non-spam comment the method will return the string `OK`.
Now it's just a matter of filtering out this value, e.g. using regular expressions or by actually parsing the response.
I hope you enjoyed seeing how easy it is to integrated useful services into your website.
It would be nice to get some feedback.
Maybe you found similar solutions or used other hacks.
---
### eLearning Course Project Sketches.
- URL: https://hackenberg.tech/posts/2009_02_22_elearning_course_project/
- Date: 2009-02-21
- Tags: drawing, education, user-interface
- Summary: Here are some impressions from my last term at university. I participated in a course called eLearning. The goal was to teach us how to develop eLearning produc...
Our course project was develop a system for teaching students how to use polymorphism in object-oriented programming languages.
Our teams basic idea was to use cartoon characters with different roles which guide the student through the learning process.
Here is some graphical work I did for the prototype.
The learning was situated within a fictive company called *Software GmbH*:
[](./logo.jpg)
An expert guides you through the technical content of the subject:
[](./lecture.jpg)
During the course the student can take tests to assess his performance:
[](./choice.jpg)
I hope you liked the scetches.
They were developed with *GIMP* and *Wacom Bamboo*.
---
### Personal Study Management.
- URL: https://hackenberg.tech/posts/2009_02_22_personal_study_management/
- Date: 2009-02-21
- Tags: data-visualization, education, hyperkit-software, task-management
- Summary: Ein strukturiertes System zur Organisation von Prüfungsvorbereitungen mit XML-basierten Lernplänen und automatischer Fortschrittsberechnung.
The basic idea is, to have a table of the chapters, which have to be studied, their size and the overall percentage of progress after finishing it.
In the picture to the right I have posted a schedule which I created for my *eLearning* exam last year.
For this exam I had to study the production process for eLearning material.
The production process is constituted of four main entities: the *analysis* where we have to find out what should be accomplished by introducing an eLearning system, the *conception* where we create an initial prototype for the system which can be verified by the customer, the *screenplay* which describes the eLearning system in its entire detail, and finally the *production* where the system is implemented for shipping.
The plan provides me with the information of *how many slides* I have to read for each chapter.
It also provides an accumulated view, i.e. the *sum over all preceeding chapters*.
From this information we can calculate the *progress precentages*.
The progress percentages help measuring and auditing your performance.
Therefore, we also have a *status checkbox* to store your current progress.
When finishing a chapter, I usually mark it as checked.
Additionally, I write down the *key concepts and techniques*.
They are meant to give a quick overview over the chapter's contents and guide you through the details.
After having designed these learning plans by hand for each course separately over the past years, I decided to implement and automation script.
The idea was to define the learning plan in *XML* and transform the information to a printable layout via *XSL*.
The language I used for specifying layouts is *HTML*.
Alternatively, one could use *XSL FO* having the advantage of being able to generate *PDF* files directly.
But *HTML* did the trick for now.
Here is now the *XML* code which was used for specifying the *eLearning* learn plan from above:
[](./xml.png)
As you can see, I can specify the course and its structure in terms of *chapters* and *sections*.
For chapters and sections I can provide information about the number of pages.
These will be used for accumulation and percentage calculation.
Finally, I specify the *XML stylesheet* which has to be applied as a *XML processing instruction*.
This allows for opening the *XML* file in the browser directly and getting the layout displayed.
The stylesheet I cannot present in full length, as it covers around 150 lines of code.
Most of the code is responsible for generating correct percentage number in different cases.
Here is now a small excerpt:
[](./xsl.png)
What you should basically take from this code listing is, that an *HTML* document is generated on the fly.
For generating this document, I have to do mainly percentage calculations.
These have to be derived from accumulated sums and nested structures.
If you are interested in the full code, just ask me.
I can provide it later.
This was basically my technique for managing studies with a small tool chain which generates learning plans from *XML* descriptions.
I hope you liked the presentation.
Give me some feedback!
Maybe there are some nice ways to improve this idea!
---
### Lightweight Blog Implementation.
- URL: https://hackenberg.tech/posts/2009_02_17_lightweight_blog_implementation/
- Date: 2009-02-16
- Tags: blog, software-systems, web-development
- Summary: In this article I describe how this website is created. You get a good insight into the techniques and technologies used. And maybe you get good ideas for your ...
The general infrastructure of the online publication system is depicted in the figure to the right.
Most importantly, I have a *Subversion* repository installed on my *Apache* web server which is accessible via *WebDAV*.
This respository contains the entire website from the front page to all articles including the comments.
On my local workstation I have a working copy of the repository checked out and connected to a local *Apache* installation.
Here, I can make changes to the content as well as server-side components such as *PHP* scripts and directly see the changes.
When I am finished updating the website I can commit the changes to the repository which causes the files to be uploaded to the webserver.
On the webserver, the *Apache* implementation of *WebDAV* recognizes the *Subversion* commit and updates the respository database.
For the repository, additionally a *post-commit* hook is configured, which automatically updates a working copy which represents the actual online version.
Now people browsing my website can see the changes I made locally on my development machine.
Having said enough about the infrastructure of the publication system I now explain the server-side components.
First, let's have a look at the index page:
The index page provides a list of all articles posted to this Blog which is devided into media categories.
The four different media categories currently supported are *article*, *multimedia*, *link* and *announcement*.
The posts for each category are stored within a separate folder.
To generate the media lists, these folders are traveresed and the contents are extracted.
Here is a code fragment from the index page:
[](./index.png)
The function `listMedia` takes the path of the folder and the style to use as a parameter.
In return, it generates `li` HTML list items containing a reference to the article and some meta information.
You can also see the link to the *RSS* feed.
The feed resuses the function `listMedia` with a different style as shown in the next example:
[](./rss.png)
Here, the function generates `item` elements for the *RSS* feed.
The feeds for the other media types are implemented in the same way.
As we have seen, the media listing functionality can be shared by several parts of the website.
This makes it possible, to centralize the extraction of article information.
Different styles are achieved by specifying the name of a callback function (e.g. `rssFormat` or `htmlFormat`).
Having seen how articles are listed, we now have a look at the articles themselves.
Articles basically are just simple HTML pages stored in a category folder.
The following code listing shows an example taken from this website:
[](./article.png)
Each article has to define a *title*, a *date* and a *tagline*.
These information items are considered as meta-data and displayed in media listings such as the front page and the *RSS* feeds.
The function `listMedia` which has been introduced before basically extracts these attributes using *regular expressions* and passes it to the formatting functions.
The rest of the article is basic HTML and can contains simply anything you want from embedded *Youtube* videos to *JavaScript* applications.
Additionally, articles provide the means for posting comments by any user on the web.
Therefore, the HTML structures for representing the comments as well as a post form are included at the bottom of the page.
Here is an example from the previously discussed article example:
[](./comments.png)
The comment part of articles is contained within a dedicated `div` fragment.
The fragment basically contains an ordered list (represented as an `ol` element) for storing the individual posts by different users.
Each post stores the *date*, the URL of the *homepage*, the *author* name and its *content*.
Additionally, an *email* address can be attached which is stored within *PHP* tags.
This is due to keeping the email private, i.e. it will never be returned to the web browser, but can be extracted within server-side components using for example *regular expressions*.
Finally, let's have a look what happens when a user posts a comment.
Basically, a script is executed checking the integrity of the data and initiating the permanent storage.
Additionally, an email is sent to those users which have specified an email address within their post.
The following code fragment shows what happens after sending this email:
[](./commenting.png)
In the first lines, a new HTML fragment is created from the comment which conforms to the structure shown before.
Then this fragment is inserted into the article using the function `preg_replace` (this function is *regular expression* based).
After updating the content, the results are written back to the article file and the changes are commited to the repository.
This makes it possible to retrieve all updates also on the development system, i.e. my local machine.
At last, the user is redirected to the same page againg targeting the comment section (using the `#comment` suffix).
When reloading the page, the user will already get the new version with the updated comment section.
Well, that's how my Blog works.
I hope you liked the introduction into **lightweight blogging** ;).
It would be great to get some comments about it.
---
### Entrepreneurship Lab Screenshots.
- URL: https://hackenberg.tech/posts/2009_02_14_entrepreneurship_lab/
- Date: 2009-02-13
- Tags: product-design, software-systems, user-interface
- Summary: This term I participated in the lab for Entrepreneurship and New Media. The students were split into groups and assigned to an industry partner. Then, a softwar...
In our project, we were supposed to develop a CRM-application using *Grails*.
As a backend system we had to integrate *OpenGroupware*.
Maybe, I'm gonna post a more comprehensive article about the project soon.
The personal dashboard is the front page when signing in to the software:

You can tag contacts and companies and retrieve them afterwards:

Finally, this is how a contact page looks like:

I hope, you got a nice impression.
---
### German Resume.
- URL: https://hackenberg.tech/posts/2009_02_12_german_resume/
- Date: 2009-02-11
- Tags: data-visualization
- Summary: For those, who are interested in my career, here is my current resume. Unfortunatelly, for now I only have a German version. The updated English version will fo...
Download the document here:
[PDF document](/posts/2009_02_12_german_resume/document.pdf)
I hope you like the two-column layout.
The intention was to get everything interesting packed onto one page.
Give me feedback, if you like!
---
### Java Runtime UML.
- URL: https://hackenberg.tech/posts/2009_02_12_java_runtime_uml/
- Date: 2009-02-11
- Tags: data-visualization, software-architecture, software-systems
- Summary: Two years ago, I started a project called SoftRay at Siemens Corporate Research in Princeton. The tool generates UML diagrams from running Java programs. It's q...
Here's a little sample from my work:

The diagram shows a sample Java programm using four different classes.
The class methods are connected via edges indicating call dependencies.
---
### Personal Website launched!
- URL: https://hackenberg.tech/posts/2009_02_11_personal_website_launched/
- Date: 2009-02-10
- Tags: blog, web-development
- Summary: Hey everyone! I am happy, you made it to this site :). It is my first try to get something up and running. So I hope, you'll like it. I'll try my best to get so...
Here's a little about my person:
My name is Georg Hackenberg.
I am 25 years old and I am studying computer science at the [RWTH Aachen University](http://www.rwth-aachen.de).
Before coming to Aachen, I was working as a trainee at Siemens Corporate Research in Princeton.
Which reminds me: New Jersey rocks!! (Don't take me serious.)
My current interests are social network analysis, Web application development and ultimate usability design :).
Also I started gaining interest in computer graphics and video production.
With this site, I want to share my activities in these fields.
Btw, an RSS feed is following soon.
Currently, I am writing all pages by hand.
(Maybe I'll explain the publishing system some time, which is based in Subversion. It's quite simple, but works great!)
For the RSS feeds I want to write an automation script, though.
Anyway, enough for today. Take care out there in the world-wild space.
---
## 3. Academic Publications & Research Papers
### SciPort: An Adaptable Scientific Data Integration Platform for Collaborative Scientific Research
- URL: https://hackenberg.tech/publications/2007_07_vldb/
- Date/Venue: 23-27 September 2007 (33rd International Conference on Very Large Data Bases (VLDB '07), pp.1310-1313)
- Authors: Fusheng Wang, Pierre-Emmanuel Bourgue, Georg Hackenberg, Mo Wang and David Kaltschmidt
- Abstract: Scientific data are posing new challenges to data management due to the large volume, complexity and heterogeneity of the data. Meanwhile, scientific collaboration becomes increasingly important, which relies on integrating and sharing data from distributed institutions. In this demo, we present SciPort, a Web-based platform on supporting scientific data management and integration based on peer-to-peer architectures, where researchers can easily collect, publish, and share their complex scientific data across multi-institutions. SciPort provides a general metadata based data model to capture the context description of experiments and link experiment data into comprehensive metadata documents, and supports a hierarchical organization of the overall data space for data browsing. SciPort takes two alternative "peer"-to-"peer" (or peer-database-to-peer-database) based approaches to integrate scientific data: pure peer-to-peer architecture and central server based peer-to-peer architecture. The later provides a virtual view of all published data from multiple local sites and supports complex queries with XQuery. The system provides a unified framework for adaptable architectures and customizable schemas, and supplies comprehensive tool set to manage and share scientific data. SciPort was first prototyped in Siemens Corporate Research, and now becomes a mature product and has been successfully used in both biomedical research and clinical trials for scientific research communities.
```bibtex
@inproceedings{
author = {Wang, Fusheng and Bourgu{\'e}, Pierre-Emmanuel and Hackenberg, Georg and Wang, Mo and Kaltschmidt, David and Liu, Peiya},
title = {SciPort: An Adaptable Scientific Data Integration Platform for Collaborative Scientific Research},
booktitle = {Proceedings of the 33rd International Conference on Very Large Data Bases},
series = {VLDB '07},
year = {2007},
isbn = {978-1-59593-649-3},
location = {Vienna, Austria},
pages = {1310--1313},
numpages = {4},
url = {http://dl.acm.org/citation.cfm?id=1325851.1326001},
acmid = {1326001},
publisher = {VLDB Endowment},
}
```
Scientific data are posing new challenges to data management due to the large volume, complexity and heterogeneity of the data. Meanwhile, scientific collaboration becomes increasingly important, which relies on integrating and sharing data from distributed institutions. In this demo, we present SciPort, a Web-based platform on supporting scientific data management and integration based on peer-to-peer architectures, where researchers can easily collect, publish, and share their complex scientific data across multi-institutions. SciPort provides a general metadata based data model to capture the context description of experiments and link experiment data into comprehensive metadata documents, and supports a hierarchical organization of the overall data space for data browsing. SciPort takes two alternative "peer"-to-"peer" (or peer-database-to-peer-database) based approaches to integrate scientific data: pure peer-to-peer architecture and central server based peer-to-peer architecture. The later provides a virtual view of all published data from multiple local sites and supports complex queries with XQuery. The system provides a unified framework for adaptable architectures and customizable schemas, and supplies comprehensive tool set to manage and share scientific data. SciPort was first prototyped in Siemens Corporate Research, and now becomes a mature product and has been successfully used in both biomedical research and clinical trials for scientific research communities.
---
### An Adaptable XML Based Approach for Scientific Data Management and Integration
- URL: https://hackenberg.tech/publications/2008_02_spie/
- Date/Venue: 16-21 February 2008 (SPIE Medical Imaging 2008: PACS and Imaging Informatics)
- Authors: Fusheng Wang, Florian Thiel, Daniel Furrer, Cristobal Vergara-Niedermayr, Chen Qin, Georg Hackenberg, Pierre-Emmanuel Bourgue, David Kaltschmidt, Mo Wang
- Abstract: Increased complexity of scientific research poses new challenges to scientific data management. Meanwhile, scientific collaboration is becoming increasing important, which relies on integrating and sharing data from distributed institutions. We develop SciPort, a Web-based platform on supporting scientific data management and integration based on a central server based distributed architecture, where researchers can easily collect, publish, and share their complex scientific data across multi-institutions. SciPort provides an XML based general approach to model complex scientific data by representing them as XML documents. The documents capture not only hierarchical structured data, but also images and raw data through references. In addition, SciPort provides an XML based hierarchical organization of the overall data space to make it convenient for quick browsing. To provide generalization, schemas and hierarchies are customizable with XML-based definitions, thus it is possible to quickly adapt the system to different applications. While each institution can manage documents on a Local SciPort Server independently, selected documents can be published to a Central Server to form a global view of shared data across all sites. By storing documents in a native XML database, SciPort provides high schema extensibility and supports comprehensive queries through XQuery. By providing a unified and effective means for data modeling, data access and customization with XML, SciPort provides a flexible and powerful platform for sharing scientific data for scientific research communities, and has been successfully used in both biomedical research and clinical trials.
```bibtex
@proceeding{
author = {Wang, Fusheng and Thiel, Florian and Furrer, Daniel and Vergara-Niedermayr, Cristobal and Qin, Chen and Hackenberg, Georg and Bourgue, Pierre-Emmanuel and Kaltschmidt, David and Wang, Mo},
title = {An adaptable XML based approach for scientific data management and integration},
journal = {Proc. SPIE},
volume = {6919},
number = {},
pages = {69190K-69190K-10},
year = {2008},
doi = {10.1117/12.773154},
URL = { http://dx.doi.org/10.1117/12.773154},
eprint = {}
}
```
Increased complexity of scientific research poses new challenges to scientific data management. Meanwhile, scientific collaboration is becoming increasing important, which relies on integrating and sharing data from distributed institutions. We develop SciPort, a Web-based platform on supporting scientific data management and integration based on a central server based distributed architecture, where researchers can easily collect, publish, and share their complex scientific data across multi-institutions. SciPort provides an XML based general approach to model complex scientific data by representing them as XML documents. The documents capture not only hierarchical structured data, but also images and raw data through references. In addition, SciPort provides an XML based hierarchical organization of the overall data space to make it convenient for quick browsing. To provide generalization, schemas and hierarchies are customizable with XML-based definitions, thus it is possible to quickly adapt the system to different applications. While each institution can manage documents on a Local SciPort Server independently, selected documents can be published to a Central Server to form a global view of shared data across all sites. By storing documents in a native XML database, SciPort provides high schema extensibility and supports comprehensive queries through XQuery. By providing a unified and effective means for data modeling, data access and customization with XML, SciPort provides a flexible and powerful platform for sharing scientific data for scientific research communities, and has been successfully used in both biomedical research and clinical trials.
---
### Lightweight palm and finger tracking for real-time 3D gesture control
- URL: https://hackenberg.tech/publications/2011_03_ieeevr/
- Date/Venue: 19-23 March 2011 (Virtual Reality Conference (VR), 2011 IEEE, pp.19-26)
- Authors: Georg Hackenberg, Rod McCall and Wolfgang Broll
- Abstract: We present a novel technique implementing barehanded interaction with virtual 3D content by employing a time-of-flight camera. The system improves on existing 3D multi-touch systems by working regardless of lighting conditions and supplying a working volume large enough for multiple users. Previous systems were limited either by environmental requirements, working volume, or computational resources necessary for realtime operation. By employing a time-of-flight camera, the system is capable of reliably recognizing gestures at the finger level in real-time at more than 50 fps with commodity computer hardware using our newly developed precision hand and finger-tracking algorithm. Building on this algorithm, the system performs gesture recognition with simple constraint modeling over statistical aggregations of the hand appearances in a working volume of more than 8 cubic meters. Two iterations of user tests were performed on a prototype system, demonstrating the feasibility and usability of the approach as well as providing first insights regarding the acceptance of true barehanded touch-based 3D interaction.
```bibtex
@INPROCEEDINGS{
author={Hackenberg, G. and McCall, R. and Broll, Wolfgang},
booktitle={Virtual Reality Conference (VR), 2011 IEEE},
title={Lightweight palm and finger tracking for real-time 3D gesture control},
year={2011},
month={March},
pages={19-26},
doi={10.1109/VR.2011.5759431},
ISSN={1087-8270},
}
```
We present a novel technique implementing barehanded interaction with virtual 3D content by employing a time-of-flight camera. The system improves on existing 3D multi-touch systems by working regardless of lighting conditions and supplying a working volume large enough for multiple users. Previous systems were limited either by environmental requirements, working volume, or computational resources necessary for realtime operation. By employing a time-of-flight camera, the system is capable of reliably recognizing gestures at the finger level in real-time at more than 50 fps with commodity computer hardware using our newly developed precision hand and finger-tracking algorithm. Building on this algorithm, the system performs gesture recognition with simple constraint modeling over statistical aggregations of the hand appearances in a working volume of more than 8 cubic meters. Two iterations of user tests were performed on a prototype system, demonstrating the feasibility and usability of the approach as well as providing first insights regarding the acceptance of true barehanded touch-based 3D interaction.
---
### Applying formal software engineering techniques to smart grids
- URL: https://hackenberg.tech/publications/2012_05_se4sg/
- Date/Venue: 3 June 2012 (Software Engineering for the Smart Grid (SE4SG), 2012 International Workshop on, pp.50-56)
- Authors: Georg Hackenberg, Maximilian Irlbeck, Vasileios Koutsoumpas and Denis Bytschkow
- Abstract: Engineering complex systems that have to meet critical requirements is a difficult task, especially if multiple engineering disciplines are involved. Common practice in domains like the automotive or avionic industry shows that formal methods improve engineering process efficiency for embedded software due to abilities like abstraction, early verification and iterative refinement. This paper presents how existing formal software engineering methods can be adapted to meet the needs of the smart grid domain. A case study demonstrates how we develop a basic interdisciplinary but semantically integrated decomposition of a household including electric and software behavior. Finally, we provide first simulation results to evaluate the feasibility of the model as well as the presented engineering method.
```bibtex
@INPROCEEDINGS{
author={Hackenberg, G. and Irlbeck, M. and Koutsoumpas, V. and Bytschkow, D.},
booktitle={Software Engineering for the Smart Grid (SE4SG), 2012 International Workshop on},
title={Applying formal software engineering techniques to smart grids},
year={2012},
month={June},
pages={50-56}
}
```
Engineering complex systems that have to meet critical requirements is a difficult task, especially if multiple engineering disciplines are involved. Common practice in domains like the automotive or avionic industry shows that formal methods improve engineering process efficiency for embedded software due to abilities like abstraction, early verification and iterative refinement. This paper presents how existing formal software engineering methods can be adapted to meet the needs of the smart grid domain. A case study demonstrates how we develop a basic interdisciplinary but semantically integrated decomposition of a household including electric and software behavior. Finally, we provide first simulation results to evaluate the feasibility of the model as well as the presented engineering method.
---
### Towards Early Emergent Property Understanding: Merging Behavior Space Exploration and Model-based Software Engineering
- URL: https://hackenberg.tech/publications/2012_10_xm/
- Date/Venue: 1 October 2014 (2012 Extreme Modeling Workshop (XM '12), ACM, New York, NY, USA, pp.39-44)
- Authors: Georg Hackenberg and Denis Bytschkow
- Abstract: During early phases of complex systems engineering typically many structural and behavioral aspects are unclear. In particular, when it comes to constraints on the result of interactions between distributed components (emergent properties) current software engineering approaches provide limited support. Therefore, we propose an extension to current software models for describing the goals of interaction rather than the underlying decision logic. Further, we propose a generic algorithm for obtaining goal-oriented behavior. Finally, the concepts are evaluated in a case study.
```bibtex
@inproceedings{
author = {Hackenberg, Georg and Bytschkow, Denis},
title = {Towards Early Emergent Property Understanding: Merging Behavior Space Exploration and Model-based Software Engineering},
booktitle = {Proceedings of the 2012 Extreme Modeling Workshop},
series = {XM '12},
year = {2012},
isbn = {978-1-4503-1804-4},
location = {Innsbruck, Austria},
pages = {39--44},
numpages = {6},
url = {http://doi.acm.org/10.1145/2467307.2467315},
doi = {10.1145/2467307.2467315},
acmid = {2467315},
publisher = {ACM},
address = {New York, NY, USA}
}
```
During early phases of complex systems engineering typically many structural and behavioral aspects are unclear. In particular, when it comes to constraints on the result of interactions between distributed components (emergent properties) current software engineering approaches provide limited support. Therefore, we propose an extension to current software models for describing the goals of interaction rather than the underlying decision logic. Further, we propose a generic algorithm for obtaining goal-oriented behavior. Finally, the concepts are evaluated in a case study.
---
### Towards a bottom-up development of reference architectures for smart energy systems
- URL: https://hackenberg.tech/publications/2013_05_se4sg/
- Date/Venue: 18 May 2013 (Software Engineering Challenges for the Smart Grid (SE4SG), 2013 2nd International Workshop on, pp.9-16)
- Authors: Maximilian Irlbeck, Denis Bytschkow, Georg Hackenberg and Vasileios Koutsoumpas
- Abstract: Smart energy systems seem a promising choice for countries worldwide to realign their power systems to the challenges predicted for the next decades. With the will to participate in this class of systems, many solution providers design custom systems, which sometimes consist of similar parts, but are on the contrary hard to compare to each other. However, a reference describing existing commonalities is needed as a basis for many activities such as regulation design, legislation, national discussion or standardization. This paper illustrates the challenges connected with the creation of reference architectures for smart energy systems, delineates their benefits and suggests a model and method for their incremental, bottom-up development and validation through concrete system architectures.
```bibtex
@INPROCEEDINGS{,
author={Irlbeck, M. and Bytschkow, D. and Hackenberg, G. and Koutsoumpas, V.},
booktitle={Software Engineering Challenges for the Smart Grid (SE4SG), 2013 2nd International Workshop on},
title={Towards a bottom-up development of reference architectures for smart energy systems},
year={2013},
month={May},
pages={9-16}
}
```
Smart energy systems seem a promising choice for countries worldwide to realign their power systems to the challenges predicted for the next decades. With the will to participate in this class of systems, many solution providers design custom systems, which sometimes consist of similar parts, but are on the contrary hard to compare to each other. However, a reference describing existing commonalities is needed as a basis for many activities such as regulation design, legislation, national discussion or standardization. This paper illustrates the challenges connected with the creation of reference architectures for smart energy systems, delineates their benefits and suggests a model and method for their incremental, bottom-up development and validation through concrete system architectures.
---
### Modellbasierte entwicklungsmethode für modulare maschinen und anlagen
- URL: https://hackenberg.tech/publications/2013_11_28_zwf/
- Date/Venue: 28 November 2013 (Zeitschrift für wirtschaftlichen Fabrikbetrieb 108 (11), pp. 818-822)
- Authors: Christoph Richter, Georg Hackenberg and Michael F Zäh
- Abstract: Die Modularisierung von Maschinen und Anlagen wird auf Grund einer wachsenden Kundenindividualität und Variantenvielfalt zu einem entscheidenden Faktor, um an globalisierten Märkten erfolgreich zu sein. Während disziplinspezifische Modularisierungsansätze, die beispielsweise eine Wiederverwendung mechanischer Baugruppen ermöglichen, bereits etabliert sind, mangelt es noch an einer ganzheitlichen mechatronischen Modularisierung. Diese ist allerdings erforderlich, um dem zunehmend mechatronischen Charakter von Maschinen und Anlagen gerecht zu werden. Im folgenden Beitrag wird eine Methode vorgestellt, mit der mechatronische Module durch den Aufbau eines interdisziplinären Maschinenmodells entwickelt werden können.
```bibtex
@ARTICLE{richter2013modellbasierte,
author={Christoph Richter and Georg Hackenberg and Michael F Zäh},
title={Modellbasierte entwicklungsmethode für modulare maschinen und anlagen},
year={2013},
journal={Zeitschrift für wirtschaftlichen Fabrikbetrieb},
volume={108},
number={11},
pages={818-822},
publisher={De Gruyter}
}
```
Die Modularisierung von Maschinen und Anlagen wird auf Grund einer wachsenden Kundenindividualität und Variantenvielfalt zu einem entscheidenden Faktor, um an globalisierten Märkten erfolgreich zu sein. Während disziplinspezifische Modularisierungsansätze, die beispielsweise eine Wiederverwendung mechanischer Baugruppen ermöglichen, bereits etabliert sind, mangelt es noch an einer ganzheitlichen mechatronischen Modularisierung. Diese ist allerdings erforderlich, um dem zunehmend mechatronischen Charakter von Maschinen und Anlagen gerecht zu werden. Im folgenden Beitrag wird eine Methode vorgestellt, mit der mechatronische Module durch den Aufbau eines interdisziplinären Maschinenmodells entwickelt werden können.
---
### Supporting Concurrent Development of Requirements and Architecture: A Model-based Approach
- URL: https://hackenberg.tech/publications/2014_01_modelsward/
- Date/Venue: 7-9 January 2014 (Model-Driven Engineering and Software Development (MODELSWARD), 2nd International Conference on)
- Authors: Andreas Vogelsang, Sebastian Eder, Georg Hackenberg, Maximilian Junker and Sabine Teufl
- Abstract: A system’s requirements and its architecture are usually developed at least partly in parallel. This demands a continuous and automated assessment to confirm that the architecture conforms to its requirements. To enable such an assessment, the stepwise formalization of informal requirements has been proposed. However, there is no canonical set of artifacts and analysis techniques that has been evaluated for this task in practice yet. In this paper we propose an artifact model and a process that enables the continuous conformance assessment between requirements and architecture in a model-based context. We evaluate both in a development project with a group of students.
```bibtex
@inproceedings{
title={Supporting Concurrent Development of Requirements and Architecture-A Model-based Approach.},
author={Vogelsang, Andreas and Eder, Sebastian and Hackenberg, Georg and Junker, Maximilian and Teufl, Sabine},
booktitle={MODELSWARD},
pages={587--595},
year={2014}
}
```
A system’s requirements and its architecture are usually developed at least partly in parallel. This demands a continuous and automated assessment to confirm that the architecture conforms to its requirements. To enable such an assessment, the stepwise formalization of informal requirements has been proposed. However, there is no canonical set of artifacts and analysis techniques that has been evaluated for this task in practice yet. In this paper we propose an artifact model and a process that enables the continuous conformance assessment between requirements and architecture in a model-based context. We evaluate both in a development project with a group of students.
---
### A Multi-Disciplinary Modeling Technique for Requirements Management in Mechatronic Systems Engineering
- URL: https://hackenberg.tech/publications/2014_07_02_sysint/
- Date/Venue: 2-4 July 2014 (System-integrated Intelligence: New Challenges for Product and Production Engineering, 2nd International Conference on)
- Authors: Georg Hackenberg, Christoph Richter and Michael Zaeh
- Abstract: Machines and plants continuously increase in complexity due to higher customer expectations regarding their purpose and flexibility of use. For this reason, machines and plants development processes need to adapt continuously to the present situation. In addition, the growing meaning of electronic and software components in machines and plants complicates the engineering since the interaction of different disciplines leads to increasing coordination efforts and problems regarding the interface between these disciplines. To face these challenges, the suitable handling of arising requirements is one key factor for the success of engineering processes. Therefore, a multi-disciplinary modeling technique for requirements management is presented in this paper. After a summary of approaches for model-based development and requirements management in the context of mechatronic systems engineering, the modeling technique with its concepts, terms, tasks and workflows is illustrated. To demonstrate the feasibility of the proposed approach, the modeling technique was applied to a miniaturized packaging plant, which is currently developed at the Institute for Machine Tools and Industrial Management (iwb) of Technische Universität München for teaching students and benchmarking engineering methods and tools. Finally, an outlook with extensions of the concept for fault-tolerant systems and the integration of further engineering tools in order to promote a consistent engineering tool-chain is given.
```bibtex
@article{
title = "A Multi-disciplinary Modeling Technique for Requirements Management in Mechatronic Systems Engineering ",
journal = "Procedia Technology ",
volume = "15",
number = "0",
pages = "5 - 16",
year = "2014",
note = "2nd International Conference on System-Integrated Intelligence: Challenges for Product and Production Engineering ",
issn = "2212-0173",
doi = "http://dx.doi.org/10.1016/j.protcy.2014.09.029",
url = "http://www.sciencedirect.com/science/article/pii/S2212017314001443",
author = "Georg Hackenberg and Christoph Richter and Michael F. Zäh"
}
```
Machines and plants continuously increase in complexity due to higher customer expectations regarding their purpose and flexibility of use. For this reason, machines and plants development processes need to adapt continuously to the present situation. In addition, the growing meaning of electronic and software components in machines and plants complicates the engineering since the interaction of different disciplines leads to increasing coordination efforts and problems regarding the interface between these disciplines. To face these challenges, the suitable handling of arising requirements is one key factor for the success of engineering processes. Therefore, a multi-disciplinary modeling technique for requirements management is presented in this paper. After a summary of approaches for model-based development and requirements management in the context of mechatronic systems engineering, the modeling technique with its concepts, terms, tasks and workflows is illustrated. To demonstrate the feasibility of the proposed approach, the modeling technique was applied to a miniaturized packaging plant, which is currently developed at the Institute for Machine Tools and Industrial Management (iwb) of Technische Universität München for teaching students and benchmarking engineering methods and tools. Finally, an outlook with extensions of the concept for fault-tolerant systems and the integration of further engineering tools in order to promote a consistent engineering tool-chain is given.
---
### A Rapid Prototyping Approach for Smart Energy Systems Based on Partial System Models
- URL: https://hackenberg.tech/publications/2014_07_21_compsac/
- Date/Venue: 21-25 July 2014 (Computer Software and Applications Conference Workshops (COMPSACW), 2014 IEEE 38th International , pp.596-601)
- Authors: Georg Hackenberg, Maximilian Irlbeck, Vasileios Koutsoumpas and Denis Bytschkow
- Abstract: A key success factor for building smart control software for today's energy systems is a precise understanding of their behavioral requirements. However, current engineering approaches lack the possibility to validate these requirements in early phases of development. The validation is hampered by the difficulty estimating the impact of requirements on the overall system behavior before a complete system model is built. To overcome this situation, we propose a model-based rapid prototyping approach based on partial system models enabling early validation of behavioral requirements through tool-supported behavior estimation. For evaluating the approach we demonstrate our approach through a case study showing the interaction between customer and software engineer over three iterations. Finally, the approach is discussed with respect to modeling effort and required model resolution.
```bibtex
@INPROCEEDINGS{
author={Hackenberg, G. and Irlbeck, M. and Koutsoumpas, V. and Bytschkow, D.},
booktitle={Computer Software and Applications Conference Workshops (COMPSACW), 2014 IEEE 38th International},
title={A Rapid Prototyping Approach for Smart Energy Systems Based on Partial System Models},
year={2014},
month={July},
pages={596-601},
doi={10.1109/COMPSACW.2014.100},
}
```
A key success factor for building smart control software for today's energy systems is a precise understanding of their behavioral requirements. However, current engineering approaches lack the possibility to validate these requirements in early phases of development. The validation is hampered by the difficulty estimating the impact of requirements on the overall system behavior before a complete system model is built. To overcome this situation, we propose a model-based rapid prototyping approach based on partial system models enabling early validation of behavioral requirements through tool-supported behavior estimation. For evaluating the approach we demonstrate our approach through a case study showing the interaction between customer and software engineer over three iterations. Finally, the approach is discussed with respect to modeling effort and required model resolution.
---
### Formal Technical Process Specification and Verification for Automated Production Systems
- URL: https://hackenberg.tech/publications/2014_09_sam/
- Date/Venue: 29-30 September 2014 (8th System Analysis and Modeling Conference (SAM 2014))
- Authors: Georg Hackenberg, Alarico Campetelli, Christoph Legat, Jakob Mund, Sabine Teufl and Birgit Vogel-Heuser
- Abstract: The complexity of automated production systems increases constantly due to growing functional requirements and engineering discipline integration. Early design steps include the cross-discipline specification of the system’s technical process, while later steps have to ensure compatibility with the specification. Current specification techniques are able to describe and analyze certain properties on the specification level, however verification of the implementation with respect to the specification is a costly task. To overcome this situation we propose a formal modeling technique, which enables automatic verification of the implementation. We demonstrate the approach on a lab-sized automated production system and finally discuss its advantages and disadvantages.
```bibtex
@incollection{
year={2014},
isbn={978-3-319-11742-3},
booktitle={System Analysis and Modeling: Models and Reusability},
volume={8769},
series={Lecture Notes in Computer Science},
editor={Amyot, Daniel and Fonseca i Casas, Pau and Mussbacher, Gunter},
doi={10.1007/978-3-319-11743-0_20},
title={Formal Technical Process Specification and Verification for Automated Production Systems},
url={http://dx.doi.org/10.1007/978-3-319-11743-0_20},
publisher={Springer International Publishing},
author={Hackenberg, Georg and Campetelli, Alarico and Legat, Christoph and Mund, Jakob and Teufi, Sabine and Vogel-Heuser, Birgit},
pages={287-303},
language={English}
}
```
The complexity of automated production systems increases constantly due to growing functional requirements and engineering discipline integration. Early design steps include the cross-discipline specification of the system’s technical process, while later steps have to ensure compatibility with the specification. Current specification techniques are able to describe and analyze certain properties on the specification level, however verification of the implementation with respect to the specification is a costly task. To overcome this situation we propose a formal modeling technique, which enables automatic verification of the implementation. We demonstrate the approach on a lab-sized automated production system and finally discuss its advantages and disadvantages.
---
### Interface Behavior Modeling for Automatic Verification of Industrial Automation Systems' Functional Conformance
- URL: https://hackenberg.tech/publications/2014_11_at/
- Date/Venue: November 2014 (Automatisierungstechnik (at), Vol. 62, No. 11)
- Authors: Christoph Legat, Jakob Mund, Alarico Campetelli, Georg Hackenberg, Jens Folmer, Daniel Schutz, Manfred Broy and Birgit Vogel-Heuser
- Abstract: To facilitate engineering and evolution of automation systems, ensuring the correctness of the design models is an important topic. Industrial automation systems are composed of various heterogeneous elements designed by different disciplines such as mechanical, electrical/electronic and software engineering. In this contribution, an approach for modeling industrial automation systems is presented which is based on interface behavior modeling of design artifacts and which supports automatic verification of their functional conformance while considering information from various disciplines.
```bibtex
@article{
author = "Legat, Christoph and Mund, Jakob and Campetelli, Alarico and Hackenberg, Georg and Folmer, Jens and Schütz, Daniel and Broy, Manfred and Vogel-Heuser, Birgit",
title = "Interface Behavior Modeling for Automatic Verification of Industrial Automation Systems' Functional Conformance",
journal = "Automatisierungstechnik (at)",
year = "2014",
volume = "62",
number = "11",
pages = "815-825"
}
```
To facilitate engineering and evolution of automation systems, ensuring the correctness of the design models is an important topic. Industrial automation systems are composed of various heterogeneous elements designed by different disciplines such as mechanical, electrical/electronic and software engineering. In this contribution, an approach for modeling industrial automation systems is presented which is based on interface behavior modeling of design artifacts and which supports automatic verification of their functional conformance while considering information from various disciplines.
---
### Early Estimation of Multi-Objective Traffic Flow
- URL: https://hackenberg.tech/publications/2014_11_iccve/
- Date/Venue: 11-14 November 2014 (Connected Vehicles and Expo (ICCVE), 2014 International Conference on)
- Authors: Dominik Ascher and Georg Hackenberg
- Abstract: Intelligent Transportation Systems (ITS) have come a long way targeting problems such as increasing emissions and growing vehicle numbers. Current approaches address a variety of objectives including congestion management, collision avoidance, energy-efficiency and emission reduction. However, respective solutions typically are designed for and tailored to a predefined set of objectives. Consequently, the effects of drastically changing objectives cannot be assessed easily. To address this situation we present a lightweight approach to estimating multi-objective traffic flow early in systems engineering using non-deterministic models and stochastic optimization techniques. We demonstrate the feasibility of the framework using a basic traffic scenario and conclude with future work.
```bibtex
@INPROCEEDINGS{Ascher2014,
author={D. Ascher and G. Hackenberg},
booktitle={2014 International Conference on Connected Vehicles and Expo (ICCVE)},
title={Early estimation of multi-objective traffic flow},
year={2014},
pages={1056-1057},
keywords={intelligent transportation systems;stochastic programming;ITS;basic traffic scenario;collision avoidance;congestion management;emission reduction;energy-efficiency;intelligent transportation systems;multiobjective traffic flow early estimation;nondeterministic models;stochastic optimization techniques;systems engineering;Biological system modeling;Context modeling;Estimation;Optimization;Software;Vehicles;Feasibility study;intelligent transportation systems},
doi={10.1109/ICCVE.2014.7297511},
ISSN={2378-1289},
month={Nov}
}
```
Intelligent Transportation Systems (ITS) have come a long way targeting problems such as increasing emissions and growing vehicle numbers. Current approaches address a variety of objectives including congestion management, collision avoidance, energy-efficiency and emission reduction. However, respective solutions typically are designed for and tailored to a predefined set of objectives. Consequently, the effects of drastically changing objectives cannot be assessed easily. To address this situation we present a lightweight approach to estimating multi-objective traffic flow early in systems engineering using non-deterministic models and stochastic optimization techniques. We demonstrate the feasibility of the framework using a basic traffic scenario and conclude with future work.
---
### Efficient impact analysis of changes in the requirements of manufacturing automation systems
- URL: https://hackenberg.tech/publications/2015_01_01_ifac/
- Date/Venue: January 2015 (IFAC-PapersOnLine 48 (3), pp. 1482-1489)
- Authors: Sabine Teufl and Georg Hackenberg
- Abstract: Various drivers, especially increasing market dynamics, force industrial enterprises to evolve their production facilities ever more frequently. Analyzing the impact of changed requirements on the production facilities early in the engineering process would facilitate the estimation of resulting costs and therefore reduce project risk. In industrial practice, requirements specifications are typically textual lists and only structured by a table of contents; an analysis of the impact of changes within the requirements specification is extensive, as no documented information is available about how the requirements and other elements of the requirements specification depend on each other.
```bibtex
@ARTICLE{teufl2015efficient,
author={Sabine Teufl and Georg Hackenberg},
title={Efficient impact analysis of changes in the requirements of manufacturing automation systems},
year={2015},
journal={IFAC-PapersOnLine},
volume={48},
number={3},
pages={1482-1489},
publisher={Elsevier}
}
```
Various drivers, especially increasing market dynamics, force industrial enterprises to evolve their production facilities ever more frequently. Analyzing the impact of changed requirements on the production facilities early in the engineering process would facilitate the estimation of resulting costs and therefore reduce project risk. In industrial practice, requirements specifications are typically textual lists and only structured by a table of contents; an analysis of the impact of changes within the requirements specification is extensive, as no documented information is available about how the requirements and other elements of the requirements specification depend on each other.
---
### From Conception to Refinement in Mechatronics Systems Engineering
- URL: https://hackenberg.tech/publications/2015_01_icmre/
- Date/Venue: 2015 (Proceedings of the International Conference on Mechatronics and Robotics Engineering, Kuala Lumpur)
- Authors: Georg Hackenberg, Christoph Richter and Michael F Zaeh
- Abstract: The complexity of mechatronic systems increases constantly due to market requirements. Traditional engineering approaches have troubles coping with the desired functionality. A major problem is the early and continuous integration and coordination of engineering disciplines (ie mechanic, electric, and software). To address this situation and to enable a concurrent engineering of participating disciplines, a model-based approach to early conception and subsequent refinement of mechatronic systems is proposed in this paper. This approach allows specifying a high-level mechatronic concept within a single editor and the refinement of this concept by integrating it with established engineering tools. In particular, the paper outlines the technical and methodical integration of discipline-specific tools such that refinement steps can be tested automatically and continuously. The suitability of the approach is shown along …
```bibtex
@INPROCEEDINGS{hackenberg2015from,
author={Georg Hackenberg and Christoph Richter and Michael F Zaeh},
title={From Conception to Refinement in Mechatronics Systems Engineering},
year={2015},
booktitle={Proceedings of the International Conference on Mechatronics and Robotics Engineering, Kuala Lumpur}
}
```
The complexity of mechatronic systems increases constantly due to market requirements. Traditional engineering approaches have troubles coping with the desired functionality. A major problem is the early and continuous integration and coordination of engineering disciplines (ie mechanic, electric, and software). To address this situation and to enable a concurrent engineering of participating disciplines, a model-based approach to early conception and subsequent refinement of mechatronic systems is proposed in this paper. This approach allows specifying a high-level mechatronic concept within a single editor and the refinement of this concept by integrating it with established engineering tools. In particular, the paper outlines the technical and methodical integration of discipline-specific tools such that refinement steps can be tested automatically and continuously. The suitability of the approach is shown along …
---
### Imomesa–abschlussbericht
- URL: https://hackenberg.tech/publications/2015_01_imomesa/
- Date/Venue: 2015
- Authors: Georg Hackenberg, Christoph Richter and Michael Zäh
- Abstract: Derzeitige Entwicklungsprozesse im Maschinen-und Anlagenbau sind zumeist noch von einer sequenziellen und disziplinspezifischen Herangehensweise geprägt, die daraus resultiert, dass früher mechanische Lösungen den wesentlichen Anteil an der Wertschöpfung ausmachten, während Elektronik und Software eher als nachgelagerte Randthemen bei einer Maschinen-oder Anlagenentwicklung angesehen wurden [4]. Aufgrund stetig steigender Rechenleistungen von kostengünstigeren Prozessoren ist derzeit allerdings der Trend zu beobachten, dass ein Großteil der Systemfunktionalität softwaretechnisch durch Steuerungsfunktionen realisiert wird (vgl. Abbildung 1). Nach [5] ist Software bereits jetzt in weiten Teilen der Industrie ein wesentlicher Treiber für Innovationen geworden. Diesem Trend müssen zukünftig auch die Entwicklungsprozesse Rechnung tragen. Statt mechanisch geprägter Entwicklungsprinzipien müssen interdisziplinäre Herangehensweisen gefunden werden, die ein synergetisches Zusammenwirken der an der Entwicklung beteiligten Disziplinen Mechanik, Elektronik und Software ermöglichen und so zu einer besseren Produktqualität und zu einer Verkürzung von Entwicklungszeiten beitragen können [6].
```bibtex
@TECHREPORT{hackenberg2015imomesaabschlussbericht,
author={Georg Hackenberg and Christoph Richter and Michael Zäh},
title={Imomesa–abschlussbericht},
year={2015},
institution={TUM Technische Universität München, Institut für Informatik}
}
```
Derzeitige Entwicklungsprozesse im Maschinen-und Anlagenbau sind zumeist noch von einer sequenziellen und disziplinspezifischen Herangehensweise geprägt, die daraus resultiert, dass früher mechanische Lösungen den wesentlichen Anteil an der Wertschöpfung ausmachten, während Elektronik und Software eher als nachgelagerte Randthemen bei einer Maschinen-oder Anlagenentwicklung angesehen wurden [4]. Aufgrund stetig steigender Rechenleistungen von kostengünstigeren Prozessoren ist derzeit allerdings der Trend zu beobachten, dass ein Großteil der Systemfunktionalität softwaretechnisch durch Steuerungsfunktionen realisiert wird (vgl. Abbildung 1). Nach [5] ist Software bereits jetzt in weiten Teilen der Industrie ein wesentlicher Treiber für Innovationen geworden. Diesem Trend müssen zukünftig auch die Entwicklungsprozesse Rechnung tragen. Statt mechanisch geprägter Entwicklungsprinzipien müssen interdisziplinäre Herangehensweisen gefunden werden, die ein synergetisches Zusammenwirken der an der Entwicklung beteiligten Disziplinen Mechanik, Elektronik und Software ermöglichen und so zu einer besseren Produktqualität und zu einer Verkürzung von Entwicklungszeiten beitragen können [6].
---
### IMoMeSA-Abschlussbericht: Integrierte modellbasierte Entwicklung mechatronischer Systeme im Maschinen-und Anlagenbau: das IGF-Vorhaben 435 ZN der Forschungsvereinigung VDW …
- URL: https://hackenberg.tech/publications/2015_01_tum_report/
- Date/Venue: 2015 (TUM Technische Universität München, Institut für Informatik)
- Authors: Georg Hackenberg, Christoph Richter and Michael Zäh
```bibtex
@TECHREPORT{hackenberg2015imomesaabschlussbericht,
author={Georg Hackenberg and Christoph Richter and Michael Zäh},
title={IMoMeSA-Abschlussbericht: Integrierte modellbasierte Entwicklung mechatronischer Systeme im Maschinen-und Anlagenbau: das IGF-Vorhaben 435 ZN der Forschungsvereinigung VDW …},
year={2015},
institution={TUM Technische Universität München, Institut für Informatik}
}
```
undefined
---
### Effcient Impact Analysis of Changes in the Requirements of Manufacturing Automation Systems
- URL: https://hackenberg.tech/publications/2015_05_incom/
- Date/Venue: 11-13 May 2015 (15th IFAC Symposium on Information Control Problems in Manufacturing)
- Authors: Sabine Teufl and Georg Hackenberg
- Abstract: Various drivers, especially increasing market dynamics, force industrial enterprises to evolve their production facilities ever more frequently. Analyzing the impact of changed requirements on the production facilities early in the engineering process would facilitate the estimation of resulting costs and therefore reduce project risk. In industrial practice, requirements specifcations are typically textual lists and only structured by a table of contents; an analysis of the impact of changes within the requirements specifcation is extensive, as no documented information is available about how the requirements and other elements of the requirements specifcation depend on each other.
To identify impacts of changes in a requirements specifcation more effciently, this paper proposes a model-based approach that classifes the elements of a requirements specifcation according to their contents and based on the classifcation preselects automatically candidate elements of the requirements specifcation that are possibly affected by the change. This paper shows the application of the approach on the manufacturing automation systems domain by means of a pick and place unit (PPU) demonstrator. The technical validation demonstrates that in the example of the PPU the impact analysis is more effcient with a content model than on an unstructured list; the effort for impact analysis is reduced further when adapting the content model to the manufacturing automation systems domain.
```bibtex
@article{
title = "Efficient Impact Analysis of Changes in the Requirements of Manufacturing Automation Systems ",
journal = "IFAC-PapersOnLine ",
volume = "48",
number = "3",
pages = "1482 - 1489",
year = "2015",
note = "15th \{IFAC\} Symposium on Information Control Problems in ManufacturingINCOM 2015 ",
issn = "2405-8963",
doi = "http://dx.doi.org/10.1016/j.ifacol.2015.06.296",
url = "http://www.sciencedirect.com/science/article/pii/S2405896315005352",
author = "Sabine Teufl and Georg Hackenberg"
}
```
Various drivers, especially increasing market dynamics, force industrial enterprises to evolve their production facilities ever more frequently. Analyzing the impact of changed requirements on the production facilities early in the engineering process would facilitate the estimation of resulting costs and therefore reduce project risk. In industrial practice, requirements specifcations are typically textual lists and only structured by a table of contents; an analysis of the impact of changes within the requirements specifcation is extensive, as no documented information is available about how the requirements and other elements of the requirements specifcation depend on each other.
To identify impacts of changes in a requirements specifcation more effciently, this paper proposes a model-based approach that classifes the elements of a requirements specifcation according to their contents and based on the classifcation preselects automatically candidate elements of the requirements specifcation that are possibly affected by the change. This paper shows the application of the approach on the manufacturing automation systems domain by means of a pick and place unit (PPU) demonstrator. The technical validation demonstrates that in the example of the PPU the impact analysis is more effcient with a content model than on an unstructured list; the effort for impact analysis is reduced further when adapting the content model to the manufacturing automation systems domain.
---
### Modellbasierte Konzeption von Benutzerschnittstellen im Entwicklungsprozess von mechatronischen Systemen
- URL: https://hackenberg.tech/publications/2015_09_tdse/
- Date/Venue: 30 September 2015 (Tag des Systems Engineering)
- Authors: Christoph Richter, Georg Hackenberg, Peter Stich and Gunther Reinhart
- Abstract: Aufgrund der juengsten Entwicklungen im Konsumgueterbereich ruecken Benutzerschnittstellen (HMIs) zunehmend in den Fokus des Maschinen- und Anlagenbaus. In etablierten Vorgehensmodellen der Entwicklung stellen HMIs jedoch lediglich ein Randthema dar, was die Realisierung intuitiver Bedienkonzepte erschwert. Vor diesem Hintergrund wird im folgenden Beitrag ein integrativer Entwicklungsansatz vorgestellt, der bereits in der fruehen Phase des Entwicklungsprozesses eine Konzeption von HMIs unterstuetzt. Dazu wird eine bestehende Modellierungstechnik zur Abbildung mechatronischer Systeme um HMI-relevante Elemente erweitert. Anhand eines industrienahen Fallbeispiels wird der Umgang mit dem neuen Entwicklungsansatz verdeutlicht sowie die praktische Anwendbarkeit evaluiert. Auf dieser Basis werden in einem Ausblick Potenziale zur Optimierung und Anpassung des Ansatzes abgeleitet.
```bibtex
@article{Richter2015,
title={Modellbasierte Konzeption von Benutzerschnittstellen im Entwicklungsprozess von mechatronischen Systemen},
author={Richter, Christoph and Hackenberg, Georg and Stich, Peter and Reinhart, Gunther},
journal={Tag des Systems Engineering: Verteiltes Arbeiten mit ganzheitlicher Kontrolle},
pages={81},
year={2015},
publisher={Carl Hanser Verlag GmbH Co KG}
}
```
Aufgrund der juengsten Entwicklungen im Konsumgueterbereich ruecken Benutzerschnittstellen (HMIs) zunehmend in den Fokus des Maschinen- und Anlagenbaus. In etablierten Vorgehensmodellen der Entwicklung stellen HMIs jedoch lediglich ein Randthema dar, was die Realisierung intuitiver Bedienkonzepte erschwert. Vor diesem Hintergrund wird im folgenden Beitrag ein integrativer Entwicklungsansatz vorgestellt, der bereits in der fruehen Phase des Entwicklungsprozesses eine Konzeption von HMIs unterstuetzt. Dazu wird eine bestehende Modellierungstechnik zur Abbildung mechatronischer Systeme um HMI-relevante Elemente erweitert. Anhand eines industrienahen Fallbeispiels wird der Umgang mit dem neuen Entwicklungsansatz verdeutlicht sowie die praktische Anwendbarkeit evaluiert. Auf dieser Basis werden in einem Ausblick Potenziale zur Optimierung und Anpassung des Ansatzes abgeleitet.
---
### Integrated transportation and power system modeling
- URL: https://hackenberg.tech/publications/2015_10_iccve/
- Date/Venue: 19-23 October 2015 (Connected Vehicles and Expo (ICCVE), 2015 International Conference on)
- Authors: Dominik Ascher and Georg Hackenberg
- Abstract: Undesired impacts on the power system caused by electric vehicles (EVs) remain a major challenge that needs to be addressed to guarantee their safe widespread adaption. In this context, efficiently balancing power demand power grids represents a fundamental issue of vehicle-to-grid (V2G) applications of EV. Here, existing approaches cover only a limited set of features required to achieve integrated multi-objective transportation and power system modeling. In this paper, we investigate an approach for holistic and integrated modeling of transportation systems and electric networks, covering electric devices within the power system and individual cars on the traffic network which make up the transportation system. The approach allows for rapid variation and evaluation of scenarios of both transportation systems and electric networks by varying their configuration, composition and underlying objectives. We apply our approach to different incremental small-scale V2G example scenarios. Obtained simulation results show the feasibility of the approach in terms of the employed modeling technique. Based on simulation results, we conclude with an evaluation of our approach with respect to it's validity, novelty, efficiency and applicability.
```bibtex
@INPROCEEDINGS{Ascher2015,
author={D. Ascher and G. Hackenberg},
booktitle={2015 International Conference on Connected Vehicles and Expo (ICCVE)},
title={Integrated transportation and power system modeling},
year={2015},
pages={379-384},
keywords={electric vehicles;power grids;EV;V2G applications;electric devices;electric vehicles;integrated multiobjective transportation;integrated transportation;power grids;power system modeling;vehicle-to-grid applications;Charging stations;Power system dynamics;Power system stability;Vehicle dynamics;Vehicles;Feasibility study;electric vehicles;intelligent transportation systems;rapid prototyping;smart grids},
doi={10.1109/ICCVE.2015.23},
month={Oct}
}
```
Undesired impacts on the power system caused by electric vehicles (EVs) remain a major challenge that needs to be addressed to guarantee their safe widespread adaption. In this context, efficiently balancing power demand power grids represents a fundamental issue of vehicle-to-grid (V2G) applications of EV. Here, existing approaches cover only a limited set of features required to achieve integrated multi-objective transportation and power system modeling. In this paper, we investigate an approach for holistic and integrated modeling of transportation systems and electric networks, covering electric devices within the power system and individual cars on the traffic network which make up the transportation system. The approach allows for rapid variation and evaluation of scenarios of both transportation systems and electric networks by varying their configuration, composition and underlying objectives. We apply our approach to different incremental small-scale V2G example scenarios. Obtained simulation results show the feasibility of the approach in terms of the employed modeling technique. Based on simulation results, we conclude with an evaluation of our approach with respect to it's validity, novelty, efficiency and applicability.
---
### Integrated Requirements and Systems Modeling in the Mechatronic Development Process
- URL: https://hackenberg.tech/publications/2015_12_dese/
- Date/Venue: 13-14 December 2015 (8th International Conference on Developments in eSystems Engineering)
- Authors: Christoph Richter, Georg Hackenberg and Michael Zaeh
- Abstract: Manufacturing systems continuously increase in complexity due to higher customer expectations regarding their purpose and flexibility of use. In addition, the growing meaning of electronic and software components in manufacturing systems complicates the engineering since the interaction of different disciplines leads to increasing coordination efforts and problems regarding the interfaces between these disciplines. For these reasons, development processes in this context need to be adapted continuously to the present situation. To face these challenges, the suitable handling of arising requirements is one key factor for the success of engineering processes. Therefore, a modeling technique for an integrated requirements and systems modeling in the mechatronic development process is presented in this paper. After a summary of approaches for model-based development and requirements engineering in the context of mechatronic systems, the modeling technique is illustrated on a meta-model level. To demonstrate the feasibility, the proposed approach is applied to a miniaturized packaging machine, which is currently developed at the Institute for Machine Tools and Industrial Management (iwb) of Technische Universitaet Mueunchen for benchmarking engineering methods and tools. Excerpts of this application are outlined in this paper as well as the results of a discussion with experts from the machine tools industry regarding the presented modeling approach. Finally, an outlook with respect to possible enhancements of the modeling technique is given.
```bibtex
@INPROCEEDINGS{Richter2015,
author = {C. Richter and G. Hackenberg and M. F. Zäh and G. Reinhart},
booktitle = {2015 International Conference on Developments of E-Systems Engineering (DeSE)},
title = {Integrated Requirements and Systems Modeling in the Mechatronic Development Process},
year = {2015},
pages = {324-331},
keywords = {Analytical models;Mechatronics;Object oriented modeling;Requirements engineering;Software;Unified modeling language},
doi = {10.1109/DeSE.2015.43},
month = {Dec}
}
```
Manufacturing systems continuously increase in complexity due to higher customer expectations regarding their purpose and flexibility of use. In addition, the growing meaning of electronic and software components in manufacturing systems complicates the engineering since the interaction of different disciplines leads to increasing coordination efforts and problems regarding the interfaces between these disciplines. For these reasons, development processes in this context need to be adapted continuously to the present situation. To face these challenges, the suitable handling of arising requirements is one key factor for the success of engineering processes. Therefore, a modeling technique for an integrated requirements and systems modeling in the mechatronic development process is presented in this paper. After a summary of approaches for model-based development and requirements engineering in the context of mechatronic systems, the modeling technique is illustrated on a meta-model level. To demonstrate the feasibility, the proposed approach is applied to a miniaturized packaging machine, which is currently developed at the Institute for Machine Tools and Industrial Management (iwb) of Technische Universitaet Mueunchen for benchmarking engineering methods and tools. Excerpts of this application are outlined in this paper as well as the results of a discussion with experts from the machine tools industry regarding the presented modeling approach. Finally, an outlook with respect to possible enhancements of the modeling technique is given.
---
### From Conception to Refinement in Mechatronic Systems Engineering
- URL: https://hackenberg.tech/publications/2016_02_ijmmm/
- Date/Venue: February 2016 (International Journal of Materials, Mechatronics and Manufacturing, Vol. 4, No. 1)
- Authors: Georg Hackenberg, Christoph Richter and Michael Zaeh
- Abstract: The complexity of mechatronic systems increases constantly due to market requirements. Traditional engineering approaches have troubles coping with the desired functionality. A major problem is the early and continuous integration and coordination of engineering disciplines (i.e. mechanic, electric, and software). To address this situation and to enable a concurrent engineering of participating disciplines, a model-based approach to early conception and subsequent refinement of mechatronic systems is proposed in this paper. This approach allows specifying a high-level mechatronic concept within a single editor and the refinement of this concept by integrating it with established engineering tools. In particular, the paper outlines the technical and methodical integration of discipline-specific tools such that refinement steps can be tested automatically and continuously. The suitability of the approach is shown along selected examples. Finally, the paper finishes with a reflection on the current state and an outlook on future research activities.
```bibtex
@article{Hackenberg2016,
author = {Georg Hackenberg and Christoph Richter and Michael Z\"ah},
title = {From Conception to Refinement in Mechatronics Systems Engineering},
journal = {International Journal of Materials, Mechanics and Manufacturing},
year = 2016,
number = 1,
pages = {66-73},
month = 2,
volume = 4
}
```
The complexity of mechatronic systems increases constantly due to market requirements. Traditional engineering approaches have troubles coping with the desired functionality. A major problem is the early and continuous integration and coordination of engineering disciplines (i.e. mechanic, electric, and software). To address this situation and to enable a concurrent engineering of participating disciplines, a model-based approach to early conception and subsequent refinement of mechatronic systems is proposed in this paper. This approach allows specifying a high-level mechatronic concept within a single editor and the refinement of this concept by integrating it with established engineering tools. In particular, the paper outlines the technical and methodical integration of discipline-specific tools such that refinement steps can be tested automatically and continuously. The suitability of the approach is shown along selected examples. Finally, the paper finishes with a reflection on the current state and an outlook on future research activities.
---
### MaCon: Consistent Cross-Disciplinary Conception of Manufacturing Systems
- URL: https://hackenberg.tech/publications/2016_06_mim/
- Date/Venue: 28-30 June 2016 (8th IFAC Conference on Manufacturing Modelling, Management & Control)
- Authors: Georg Hackenberg, Thomas Stocker, Christoph Richter and Gunther Reinhart
- Abstract: Conceptual designs of manufacturing systems contain input from all engineering disciplines involved in the life cycle of such systems. For their efficient and consistent conception, information about the elements of a conceptual design and their relationships have to be sufficiently precise but preferably abstract. We employ a cross-disciplinary modeling technique to capture this information together with consistency checking including simulation to accomplish such a challenging task. In this paper, we demonstrate our approach with a tool prototype. Based on an industrial example, we highlight how the features of the tool prototype can effectively support tasks in conceptual design. To illustrate this effectiveness, we visualize the modeling work flow and the results of the consistency checks based on data collected during tool usage.
```bibtex
@article{Hackenberg2016,
title = "MaCon: Consistent Cross-Disciplinary Conception of Manufacturing Systems ",
journal = "IFAC-PapersOnLine ",
volume = "49",
number = "12",
pages = "1175 - 1180",
year = "2016",
note = "8th \{IFAC\} Conference on Manufacturing Modelling, Management and Control \{MIM\} 2016Troyes, France, 28—30 June 2016 ",
issn = "2405-8963",
doi = "http://dx.doi.org/10.1016/j.ifacol.2016.07.665",
url = "http://www.sciencedirect.com/science/article/pii/S2405896316309417",
author = "Georg Hackenberg and Mario Gleirscher and Thomas Stocker and Christoph Richter and Gunther Reinhart",
keywords = "Manufacturing",
keywords = "mechatronics",
keywords = "engineering",
keywords = "modeling",
keywords = "simulation",
keywords = "testing "
}
```
Conceptual designs of manufacturing systems contain input from all engineering disciplines involved in the life cycle of such systems. For their efficient and consistent conception, information about the elements of a conceptual design and their relationships have to be sufficiently precise but preferably abstract. We employ a cross-disciplinary modeling technique to capture this information together with consistency checking including simulation to accomplish such a challenging task. In this paper, we demonstrate our approach with a tool prototype. Based on an industrial example, we highlight how the features of the tool prototype can effectively support tasks in conceptual design. To illustrate this effectiveness, we visualize the modeling work flow and the results of the consistency checks based on data collected during tool usage.
---
### The TRANSP-0 framework for integrated transportation and power system design
- URL: https://hackenberg.tech/publications/2016_11_itsc/
- Date/Venue: 01-04 November 2016 (19th IEEE International Conference on Intelligent Transportation Systems (ITSC 2016))
- Authors: Dominik Ascher and Georg Hackenberg
- Abstract: Increasing penetration of decentralized energy production as well as the propagation of new transportation paradigms such as transportation electrification, autonomous vehicles and mobility-on-demand will require interrelated key changes to current transportation and power systems. To diminish negative environmental impacts and achieve longterm sustainability, close integration between transportation and power systems is necessary and integrated planning, operation and control strategies have to be established. In this paper, we present TRANSP-0, a system design framework for rapid formulation and evaluation of design options within integrated transportation and power systems. Firstly, we present the TRANSP-0 design space in terms of the static parameters for integrated subsystem design. Secondly, we visit the dynamic properties of subsystem design by formulating the underlying optimal control problem. Thirdly, we establish the requirements to integrated control strategies in terms of objectives and constraints of the described optimal control problem. Finally, we conclude with an outlook on the future scope of the proposed system design framework.
Increasing penetration of decentralized energy production as well as the propagation of new transportation paradigms such as transportation electrification, autonomous vehicles and mobility-on-demand will require interrelated key changes to current transportation and power systems. To diminish negative environmental impacts and achieve longterm sustainability, close integration between transportation and power systems is necessary and integrated planning, operation and control strategies have to be established. In this paper, we present TRANSP-0, a system design framework for rapid formulation and evaluation of design options within integrated transportation and power systems. Firstly, we present the TRANSP-0 design space in terms of the static parameters for integrated subsystem design. Secondly, we visit the dynamic properties of subsystem design by formulating the underlying optimal control problem. Thirdly, we establish the requirements to integrated control strategies in terms of objectives and constraints of the described optimal control problem. Finally, we conclude with an outlook on the future scope of the proposed system design framework.
---
### The passenger extension of the TRANSP-0 system design framework
- URL: https://hackenberg.tech/publications/2017_06_26_mtits/
- Date/Venue: 26 June 2017 (2017 5th IEEE International Conference on Models and Technologies for Intelligent Transportation Systems (MT-ITS), pp. 256-261)
- Authors: Dominik Ascher and Georg Hackenberg
- Abstract: In recent years, potentially disruptive transportation paradigms such as mobility-on-demand, autonomous vehicles and the transportation electrification have seen increased attention for designing intelligent transportation systems (ITS). These paradigms represent unifying approaches in addressing sustainable alignment between transportation demand and supply in the context of rising world passenger transport energy use and increasing negative environmental impacts. It is crucial to establish integrated planning and control strategies for both transportation and power systems, as the aforementioned paradigms exert interrelated and concurrent effects on these systems. To evaluate future transportation and power system design options coherently and explore the potential effects of the aforementioned paradigms, in this work, we extend the design space of a formal system design framework for integrated …
```bibtex
@INPROCEEDINGS{ascher2017the,
author={Dominik Ascher and Georg Hackenberg},
title={The passenger extension of the TRANSP-0 system design framework},
year={2017},
booktitle={2017 5th IEEE International Conference on Models and Technologies for Intelligent Transportation Systems (MT-ITS)},
pages={256-261},
publisher={IEEE}
}
```
In recent years, potentially disruptive transportation paradigms such as mobility-on-demand, autonomous vehicles and the transportation electrification have seen increased attention for designing intelligent transportation systems (ITS). These paradigms represent unifying approaches in addressing sustainable alignment between transportation demand and supply in the context of rising world passenger transport energy use and increasing negative environmental impacts. It is crucial to establish integrated planning and control strategies for both transportation and power systems, as the aforementioned paradigms exert interrelated and concurrent effects on these systems. To evaluate future transportation and power system design options coherently and explore the potential effects of the aforementioned paradigms, in this work, we extend the design space of a formal system design framework for integrated …
---
### Test-driven conceptual design of cyber-physical manufacturing systems
- URL: https://hackenberg.tech/publications/2018_01_tum/
- Date/Venue: 2018 (Technische Universität München)
- Authors: Georg Hackenberg
- Abstract: Today, manufacturing system engineering companies face three major trends: First, the systems have to implement more functions and, hence, grow in complexity. Then, besides mechanical engineering discipline the electrical and software engineering disciplines contribute more and more to the functionality of the system and, hence, require increasing efforts. And finally, the integration of the components from the individual engineering disciplines has become a costly task taking up to 25% of the p...»
```bibtex
@TECHREPORT{hackenberg2018testdriven,
author={Georg Hackenberg},
title={Test-driven conceptual design of cyber-physical manufacturing systems},
year={2018},
institution={Technische Universität München}
}
```
Today, manufacturing system engineering companies face three major trends: First, the systems have to implement more functions and, hence, grow in complexity. Then, besides mechanical engineering discipline the electrical and software engineering disciplines contribute more and more to the functionality of the system and, hence, require increasing efforts. And finally, the integration of the components from the individual engineering disciplines has become a costly task taking up to 25% of the p...»
---
### GITHUB FOR PRODUCT DEVELOPMENT-HOW COULD THAT LOOK LIKE?
- URL: https://hackenberg.tech/publications/2023_07_design_society/
- Date/Venue: July 2023 (Proceedings of the Design Society 3, pp. 2055-2064)
- Authors: Georg Hackenberg, Christian Zehetner and Dominik Frühwirth
- Abstract: Product development is facing new challenges due to increasingly complex and individualized products in small batch sizes and short time to markets at high quality standards. Integrated product data management along with systematic requirements engineering and early stakeholder involvement are known to be key enablers for the success of future product development. In software development, established platforms such as GitHub exist, which have been shown to improve stakeholder communication, requirements elicitation, and software design decisions. In product development, similar platforms exist with impressive functionality, but which have some drawbacks such as closed source licenses, vendor-specific data formats, and expert-level user interfaces. To overcome the current situation, we study how the ideas of GitHub can be translated to an open source solution for product development and which …
```bibtex
@INPROCEEDINGS{hackenberg2023github,
author={Georg Hackenberg and Christian Zehetner and Dominik Frühwirth},
title={GITHUB FOR PRODUCT DEVELOPMENT-HOW COULD THAT LOOK LIKE?},
year={2023},
booktitle={Proceedings of the Design Society},
volume={3},
pages={2055-2064},
publisher={Cambridge University Press}
}
```
Product development is facing new challenges due to increasingly complex and individualized products in small batch sizes and short time to markets at high quality standards. Integrated product data management along with systematic requirements engineering and early stakeholder involvement are known to be key enablers for the success of future product development. In software development, established platforms such as GitHub exist, which have been shown to improve stakeholder communication, requirements elicitation, and software design decisions. In product development, similar platforms exist with impressive functionality, but which have some drawbacks such as closed source licenses, vendor-specific data formats, and expert-level user interfaces. To overcome the current situation, we study how the ideas of GitHub can be translated to an open source solution for product development and which …
---
### Quality assurance of digital twins: an experience report in the automotive industry
- URL: https://hackenberg.tech/publications/2023_09_11_quatic/
- Date/Venue: 11 September 2023 (International Conference on the Quality of Information and Communications Technology, pp. 15-29)
- Authors: Alican Tüzün and Georg Hackenberg
- Abstract: Digital twins are becoming increasingly important for the efficient and effective development and operation of cyber-physical systems. However, digital twins are only useful if they reflect the real-world system accurately enough, i.e. their quality is high enough. This claim entails the question, of what the term quality in the context of digital twins means and how it can be measured. In this article, the authors presented their experience with the quality assurance of a digital twin for an assembly line in the automotive industry. Authors explained the preliminary definition of digital twin quality, which authors derived from classical quality models for general software systems. Furthermore, authors described quality issues, which they were able to detect in a digital twin of an assembly line in the automotive industry. Finally, authors concluded how to leverage their experience in different contexts and how to generalize the …
```bibtex
@INPROCEEDINGS{tuezuen2023quality,
author={Alican Tüzün and Georg Hackenberg},
title={Quality assurance of digital twins: an experience report in the automotive industry},
year={2023},
booktitle={International Conference on the Quality of Information and Communications Technology},
pages={15-29},
publisher={Springer Nature Switzerland}
}
```
Digital twins are becoming increasingly important for the efficient and effective development and operation of cyber-physical systems. However, digital twins are only useful if they reflect the real-world system accurately enough, i.e. their quality is high enough. This claim entails the question, of what the term quality in the context of digital twins means and how it can be measured. In this article, the authors presented their experience with the quality assurance of a digital twin for an assembly line in the automotive industry. Authors explained the preliminary definition of digital twin quality, which authors derived from classical quality models for general software systems. Furthermore, authors described quality issues, which they were able to detect in a digital twin of an assembly line in the automotive industry. Finally, authors concluded how to leverage their experience in different contexts and how to generalize the …
---
### Model-based design of integrated transportation systems using approximate dynamic programming
- URL: https://hackenberg.tech/publications/2023_09_24_itsc/
- Date/Venue: 24 September 2023 (2023 IEEE 26th International Conference on Intelligent Transportation Systems (ITSC), pp. 4443-4450)
- Authors: Dominik Ascher, Georg Hackenberg and Sahin Albayrak
- Abstract: Based on recent developments and technological advances, the complexity and number of systems and services for intelligent transportation systems (ITS) has risen dramatically. The interactions between these systems and services require systematic development methods for their integrated structural design as well as their behavioral planning in terms of integrated control strategies, which can address multiple as well as heterogenous goals. To address this situation, in this work, we propose an approach for integrated modeling of heterogenous ITS systems and their integrated evaluation using approximate dynamic programming (ADP). For this, we introduce a methodology which incorporates the necessary design principles and requirements to address above challenges. Then, we present an integrated systems modeling technique which is used for problem formulation. In addition to problem formulation, it …
```bibtex
@INPROCEEDINGS{ascher2023modelbased,
author={Dominik Ascher and Georg Hackenberg and Sahin Albayrak},
title={Model-based design of integrated transportation systems using approximate dynamic programming},
year={2023},
booktitle={2023 IEEE 26th International Conference on Intelligent Transportation Systems (ITSC)},
pages={4443-4450},
publisher={IEEE}
}
```
Based on recent developments and technological advances, the complexity and number of systems and services for intelligent transportation systems (ITS) has risen dramatically. The interactions between these systems and services require systematic development methods for their integrated structural design as well as their behavioral planning in terms of integrated control strategies, which can address multiple as well as heterogenous goals. To address this situation, in this work, we propose an approach for integrated modeling of heterogenous ITS systems and their integrated evaluation using approximate dynamic programming (ADP). For this, we introduce a methodology which incorporates the necessary design principles and requirements to address above challenges. Then, we present an integrated systems modeling technique which is used for problem formulation. In addition to problem formulation, it …
---
### A discrete event formalism for fast simulation of on-demand transportation systems
- URL: https://hackenberg.tech/publications/2023_12_11_isda/
- Date/Venue: 11 December 2023 (International Conference on Intelligent Systems Design and Applications, pp. 185-197)
- Authors: Dominik Ascher and Georg Hackenberg
- Abstract: The interconnection between intelligent transportation systems (ITS) and services poses fundamental challenges with respect to establishing most efficient structures as well as intelligent and integrated control strategies addressing new transportation paradigms such as autonomous vehicles, mobility-on-demand as well as the transportation electrification. Systematic and integrated methods for efficiently modeling, simulating and evaluating these systems are required, which are able to address aforementioned challenges. For this, we present a discrete event formalism for fast simulation of on-demand transportation systems, which provides a formalization of essential static properties, dynamic state functions, as well as events concisely describing transportation system design space in the scope of emerging transportation paradigms. Our formalism allows for reduction of computational complexity by defining …
```bibtex
@INPROCEEDINGS{ascher2023a,
author={Dominik Ascher and Georg Hackenberg},
title={A discrete event formalism for fast simulation of on-demand transportation systems},
year={2023},
booktitle={International Conference on Intelligent Systems Design and Applications},
pages={185-197},
publisher={Springer Nature Switzerland}
}
```
The interconnection between intelligent transportation systems (ITS) and services poses fundamental challenges with respect to establishing most efficient structures as well as intelligent and integrated control strategies addressing new transportation paradigms such as autonomous vehicles, mobility-on-demand as well as the transportation electrification. Systematic and integrated methods for efficiently modeling, simulating and evaluating these systems are required, which are able to address aforementioned challenges. For this, we present a discrete event formalism for fast simulation of on-demand transportation systems, which provides a formalization of essential static properties, dynamic state functions, as well as events concisely describing transportation system design space in the scope of emerging transportation paradigms. Our formalism allows for reduction of computational complexity by defining …
---
### Digital twin and digital thread within the product lifecycle management
- URL: https://hackenberg.tech/publications/2024_01_01_procedia/
- Date/Venue: January 2024 (Procedia Computer Science 232, pp. 2875-2886)
- Authors: Christine Lehner, Antonio Padovano, Christian Zehetner and Georg Hackenberg
- Abstract: This research explores Digital Twins (DT) and Digital Threads (DTH) in Product Lifecycle Management (PLM) for Industry 4.0, resolving data loss and audit complexity. In today's VUCA-defined age, accelerated by rapid digital transformation, the manufacturing sector requires seamless data flow across the product lifecycle. This paper highlights the growing potential of Industry 4.0, addressing practical guidelines for digital twin prototypes and continuous quality audits.
```bibtex
@ARTICLE{lehner2024digital,
author={Christine Lehner and Antonio Padovano and Christian Zehetner and Georg Hackenberg},
title={Digital twin and digital thread within the product lifecycle management},
year={2024},
journal={Procedia Computer Science},
volume={232},
pages={2875-2886},
publisher={Elsevier}
}
```
In today's VUCA-defined age, accelerated by the rapid digital transformation brought on by the COVID-19 pandemic, the business sector needs to be able to adapt to expected and unexpected changes. Consistently improving the product quality and managing the whole product life cycle, starting from the new product development (NPD) process, and the related data, are important aspects of keeping a company competitive in a global landscape. This paper highlights the growing potential of Industry 4.0, particularly the digital thread (DTH) and digital twin (DT), in addressing these challenges. The research revealed existing gaps in clarity and practical guidelines for digital twin prototypes (DTP) and DTH in the existing literature. Moreover, additional issues within product life cycle management (PLM) were stated, regarding frequent data loss and the complexity of product audits in the perspective of a continuous …
---
### Learnings from developing a custom virtual assembly environment for mountability issues of cooling cabinets
- URL: https://hackenberg.tech/publications/2024_05_design_society/
- Date/Venue: May 2024 (Proceedings of the Design Society 4, pp. 583-592)
- Authors: Georg Hackenberg and Christian Zehetner
- Abstract: Various industries use computer simulation for verifying product properties in early phases of development. Traditionally, such properties include the stability of mechanical structures or the efficiency of aircraft turbines. More recently, research also focuses on the mountability of industrial products using virtual assembly. While research on virtual assembly already started in the mid-1990s, the applicability in different industries remains largely unclear today. To advance the state-of-the-art, in this paper we present learnings from developing a virtual assembly environment for cooling cabinets.
```bibtex
@INPROCEEDINGS{hackenberg2024learnings,
author={Georg Hackenberg and Christian Zehetner},
title={Learnings from developing a custom virtual assembly environment for mountability issues of cooling cabinets},
year={2024},
booktitle={Proceedings of the Design Society},
volume={4},
pages={583-592},
publisher={Cambridge University Press}
}
```
Various industries use computer simulation for verifying product properties in early phases of development. Traditionally, such properties include the stability of mechanical structures or the efficiency of aircraft turbines. More recently, research also focuses on the mountability of industrial products using virtual assembly. While research on virtual assembly already started in the mid-1990s, the applicability in different industries remains largely unclear today. To advance the state-of-the-art, in this paper we present learnings from developing a virtual assembly environment for cooling cabinets.
---
### On modeling, discrete-event simulation, and optimization of spine layouts
- URL: https://hackenberg.tech/publications/2025_01_01_procedia_cirp/
- Date/Venue: January 2025 (Procedia CIRP 134, pp. 633-638)
- Authors: Chiara Sammarco, Antonio Padovano and Georg Hackenberg
- Abstract: Today, discrete-event simulation (DES) has proven to be an essential tool for designing complex high-performance and cost-effective manufacturing systems. However, a significant challenge still lies in modeling specialized system layouts such as the spine layout, which is characterized by a central aisle flanked by corridors with workstations and served by an overhead automated material handling system. While the spine layout has demonstrated to be suitable in industries with complex operational requirements, current DES tools still lack dedicated modeling constructs for this type of layout and its characteristic properties, making the modeling process time-consuming and error-prone. To overcome the current situation, we develop a basic formalism that captures essential properties of spine layouts and defines their inherent discrete-event simulation semantics. Furthermore, we elaborate on the layout …
```bibtex
@ARTICLE{sammarco2025on,
author={Chiara Sammarco and Antonio Padovano and Georg Hackenberg},
title={On modeling, discrete-event simulation, and optimization of spine layouts},
year={2025},
journal={Procedia CIRP},
volume={134},
pages={633-638},
publisher={Elsevier}
}
```
Today, discrete-event simulation (DES) has proven to be an essential tool for designing complex high-performance and cost-effective manufacturing systems. However, a significant challenge still lies in modeling specialized system layouts such as the spine layout, which is characterized by a central aisle flanked by corridors with workstations and served by an overhead automated material handling system. While the spine layout has demonstrated to be suitable in industries with complex operational requirements, current DES tools still lack dedicated modeling constructs for this type of layout and its characteristic properties, making the modeling process time-consuming and error-prone. To overcome the current situation, we develop a basic formalism that captures essential properties of spine layouts and defines their inherent discrete-event simulation semantics. Furthermore, we elaborate on the layout …
---
### Next-Generation Design Tools for Intelligent Transportation Systems.
- URL: https://hackenberg.tech/publications/2025_01_modelsward/
- Date/Venue: 2025 (MODELSWARD, pp. 234-241)
- Authors: Dominik Ascher and Georg Hackenberg
- Abstract: Intelligent Transportation Systems (ITS) promote new transportation paradigms such as connected and autonomous vehicles (CAV), multi-modal and demand-responsive transport systems, and enable the transportation electrification by sustainable operation of electric vehicles. Methods and tools are needed to explore the possible design space for emerging transportation paradigms, which support evaluation of system design alternatives and verification of system properties. In this work, we propose a model-and simulation-based systems engineering framework for capturing design decisions and evaluating control strategies for ITS design. In addition to capturing and evaluating different design decisions, the proposed solution allows users to guide design decisions by systematic comparison and evaluation of system configurations and control strategies.
```bibtex
@INPROCEEDINGS{ascher2025nextgeneration,
author={Dominik Ascher and Georg Hackenberg},
title={Next-Generation Design Tools for Intelligent Transportation Systems.},
year={2025},
booktitle={MODELSWARD},
pages={234-241}
}
```
Intelligent Transportation Systems (ITS) promote new transportation paradigms such as connected and autonomous vehicles (CAV), multi-modal and demand-responsive transport systems, and enable the transportation electrification by sustainable operation of electric vehicles. Methods and tools are needed to explore the possible design space for emerging transportation paradigms, which support evaluation of system design alternatives and verification of system properties. In this work, we propose a model-and simulation-based systems engineering framework for capturing design decisions and evaluating control strategies for ITS design. In addition to capturing and evaluating different design decisions, the proposed solution allows users to guide design decisions by systematic comparison and evaluation of system configurations and control strategies.
---
### First experiences from using CADdrive with digital LEGO for product design and systems engineering education
- URL: https://hackenberg.tech/publications/2025_08_design_society/
- Date/Venue: August 2025 (Proceedings of the Design Society 5, pp. 1823-1832)
- Authors: Georg Hackenberg and Christian Zehetner
- Abstract: Due to rising product and system complexities, design and engineering have become a team effort that requires well planned and synchronized activities to achieve a high degree of process efficiency and effectiveness. Inspiring high school children to pursue a carreer in this field and preparing undergraduate as well as graduate students for what they will face in practice remains a challenge for societies and institutions worldwide. To overcome this situation, in this paper we present our experience from conducting two courses for Master students and one workshop for high school children based on an online collaboration platform and the digital LEGO framework. We provide insights into the organization of the different formats, the various backgrounds and profiles of their participants, the work results produced by the individual teams, as well as the participants’ learning experience.
```bibtex
@INPROCEEDINGS{hackenberg2025first,
author={Georg Hackenberg and Christian Zehetner},
title={First experiences from using CADdrive with digital LEGO for product design and systems engineering education},
year={2025},
booktitle={Proceedings of the Design Society},
volume={5},
pages={1823-1832},
publisher={Cambridge University Press}
}
```
Due to rising product and system complexities, design and engineering have become a team effort that requires well planned and synchronized activities to achieve a high degree of process efficiency and effectiveness. Inspiring high school children to pursue a carreer in this field and preparing undergraduate as well as graduate students for what they will face in practice remains a challenge for societies and institutions worldwide. To overcome this situation, in this paper we present our experience from conducting two courses for Master students and one workshop for high school children based on an online collaboration platform and the digital LEGO framework. We provide insights into the organization of the different formats, the various backgrounds and profiles of their participants, the work results produced by the individual teams, as well as the participants’ learning experience.
---
## 4. Keynote Presentations & Slide Decks
### SEO im Zeitalter von KI: Strategien für SEO, GEO, AIO und AEO
- URL: https://hackenberg.tech/presentations/2026_10_01_seo_im_zeitalter_von_ki/
- Subtitle: Von Suchmaschinen zu generativen Antwortsystemen – Paradigmenwechsel für den oberösterreichischen Industrie-Mittelstand
- Date: 2026-10-01
- Event: Industrieforum Traunviertel
- Location: Kirchdorf an der Krems, Traunviertel, Oberösterreich
- Tags: seo, geo, aio, aeo, rag, mcp, knowledge-graphs, enterprise-ai
- Summary: Strategischer Leitfaden und Fachvortrag zur Transformation von traditioneller Suchmaschinenoptimierung hin zu Generative Engine Optimization (GEO), RAG-Architekturen, Schema.org-Wissensgraphen und autonomen MCP-Entwickleragenten.
## Über diesen Vortrag
Der 60-minütige Fachvortrag vor Vertretern des oberösterreichischen Industrie- und B2B-Mittelstands im Traunviertel behandelt den fundamentalen Paradigmenwechsel der Websuche: Den Übergang von keywordbasierten Linklisten hin zu multimodaler, generativer Antwortsynthese durch Sprachmodelle (Google AI Overviews, ChatGPT Search, Perplexity).
### Zentrale Schwerpunkte:
1. **Das Zero-Click-Dilemma:** Warum über 60 % aller Suchanfragen ohne Website-Klick enden und weshalb der Wert vorqualifizierter Leads dennoch steigt.
2. **Technologisches Fundament:** Wie LLMs mit RAG, semantischen Embeddings und Wissensgraphen (GraphRAG) Fakten integrieren.
3. **Die Drei-Säulen-Methodik:** Strukturierte Daten (Schema.org / JSON-LD), Information Gain (BLUF-Prinzip) und verifizierte E-E-A-T-Signale.
4. **Entwickler-Praxis mit Agenten:** Wie autonome KI-Agenten über das Model Context Protocol (MCP) Codebases vor dem Deployment auditieren.
5. **Architektur für den Mittelstand:** Die Zwei-Geschwindigkeiten-Architektur für bestehende ERP- und CMS-Systeme (TYPO3, WordPress, SAP) mit vorgeschaltetem Astro-Edge-Layer.
---
## 5. University Courses & Educational Content
### Digital Factory & Simulation
- URL: https://hackenberg.tech/courses/course-digital-factory/
- Repository: course-digital-factory
- Language: en
- Description: Master-level course on Digital Factory and Computer Simulation (including practical exercises with the discrete event simulation software JaamSim).
- Learning Goals:
* Understand discrete event simulation principles and concepts.
* Build practical layout models with the discrete event simulation software JaamSim.
* Analyze production bottlenecks, throughput, and resource utilization.
Welcome to the **Digital Factory & Simulation** course! This master-level course bridges the gap between industrial design processes and computational validation.
## Course Overview
In modern manufacturing, building physical prototypes to test layouts is expensive and time-consuming. Discrete Event Simulation (DES) allows engineers to create high-fidelity virtual twins of factories, run experiments, and optimize configurations before a single machine is purchased.
## Syllabus Highlights
1. **Introduction to DES**: Underpinning mathematics, queueing theories, and time-advance mechanisms.
2. **JaamSim Essentials**: Hands-on navigation, layout positioning, object configuration, and route setups.
3. **Advanced Flow Control**: Custom scripting, assembly/disassembly processing, and routing expressions.
4. **Data Analysis & Optimization**: Interpreting output logs, calculating confidence intervals, and identifying bottlenecks.
---
### Mobile & Cloud Development
- URL: https://hackenberg.tech/courses/course-maui-aspnet/
- Repository: course-maui-aspnet
- Language: en
- Description: Course materials for cross-platform app development using .NET Multi-platform App UI (.NET MAUI) and ASP.NET Core cloud backend REST APIs.
- Learning Goals:
* Build cross-platform mobile & desktop graphical user interfaces with .NET MAUI.
* Design and implement secure, scalable REST APIs using ASP.NET Core.
* Integrate databases, repository patterns, and full-stack client-server communication.
Welcome to the **Mobile & Cloud Development** course! This curriculum equips you with the skills to architect and implement modern full-stack systems.
## Course Overview
We focus on building multi-device client applications (targeting iOS, Android, Windows, and macOS) that securely interface with robust, database-driven cloud backend architectures. Using Microsoft's .NET ecosystem, you'll learn the patterns used by industry professionals to deliver native performance and scalable servers.
## Syllabus Highlights
1. **Cross-Platform UI with .NET MAUI**: XAML layouts, data binding, command patterns, and MVVM architecture.
2. **REST API Design with ASP.NET Core**: Controller routing, dependency injection, middleware pipelines, and OpenAPI/Swagger documentation.
3. **Data Access & Storage**: Connecting Entity Framework Core, designing database schemas, and applying repository patterns.
4. **Integration & Security**: HTTP requests in C#, handling JSON serialization, token authentication, and API security.
---
### Python for Engineers
- URL: https://hackenberg.tech/courses/course-python-programming/
- Repository: course-python-programming
- Language: en
- Description: Practical course in Python programming, introducing scripting, numerical analysis, data visualization, and engineering simulations.
- Learning Goals:
* Master Python syntax, core data types, and file input/output workflows.
* Apply Python libraries like NumPy and Pandas for numerical and tabular data processing.
* Implement custom simulations and plot high-quality engineering visualizations.
Welcome to the **Python for Engineers** course! Python has become the lingua franca of engineering automation, data science, and system simulation. This course gets you writing code quickly.
## Course Overview
We focus on practical programming. You will transition from basic syntax to utilizing Python's powerful package ecosystem to solve engineering problems, run automated loops, analyze data sets, and build clean dashboards.
## Syllabus Highlights
1. **Python Programming Essentials**: Variables, lists, loops, conditions, functions, and modules.
2. **Scientific Computing with NumPy**: Multi-dimensional arrays, vectorized operations, and linear algebra.
3. **Data Wrangling with Pandas**: Loading datasets, filtering columns, cleaning data, and aggregating statistics.
4. **Plotting & Visuals**: Creating robust graphs and charts with Matplotlib and Seaborn.
5. **Engineering Applications**: Simulation models, differential equations solver, and scripting command-line tools.
---
### Computer-Simulation
- URL: https://hackenberg.tech/courses/kurs-computer-simulation/
- Repository: kurs-computer-simulation
- Language: de
- Description: Unterlagen für meinen Kurs in Computer-Simulation an der Fakultät für Technik und angewandte Naturwissenschaften der FH OÖ.
- Learning Goals:
* Verstehen der mathematischen Grundlagen diskreter und kontinuierlicher Simulationsmodelle.
* Implementierung von Simulationsalgorithmen in C# und anderen objektorientierten Sprachen.
* Statistische Auswertung und kritische Analyse von Simulationsergebnissen.
Herzlich willkommen zum Kurs **Computer-Simulation**! Dieser Kurs bietet eine fundierte Einführung in die Modellierung und rechnergestützte Simulation dynamischer Systeme.
## Kursübersicht
Die Simulation ist eine Schlüsseltechnologie in der modernen Produktentwicklung und Prozessoptimierung. In diesem Kurs lernen Sie, reale Systeme (wie z. B. Produktionslinien, Logistikketten oder physikalische Systeme) in formale mathematische Modelle zu überführen und diese informationstechnisch abzubilden.
## Inhaltliche Schwerpunkte
1. **Einführung in die Simulationstheorie**: Diskrete vs. kontinuierliche Simulation, Zufallszahlen und Wahrscheinlichkeitsverteilungen.
2. **Objektorientierte Modellierung**: Strukturierung von Simulationsumgebungen mit Klassen und Zustandsautomaten.
3. **Praktische Umsetzung in C#**: Aufbau eines eigenen eventgesteuerten Simulators (Discrete Event Simulator).
4. **Verifikation & Validierung**: Sicherstellen der Modellkorrektheit, Fehlerquellen erkennen und Messergebnisse statistisch absichern.
---
### Datenanalyse und SQL
- URL: https://hackenberg.tech/courses/kurs-datenanalyse/
- Repository: kurs-datenanalyse
- Language: de
- Description: Unterlagen für meinen Kurs in Datenanalyse. Einführung in relationale Datenbanken, SQL-Abfragen, analytische Datenstrukturen und Werkzeuge zur Datenauswertung.
- Learning Goals:
* Konzipieren und Abfragen relationaler Datenbanken mittels komplexer SQL-Anweisungen.
* Verstehen von Analytical Processing (OLAP) und Data-Warehouse-Konzepten.
* Visualisierung von Messdaten und Interpretation von statistischen Analysen.
Herzlich willkommen zum Kurs **Datenanalyse und SQL**! Daten sind das Gold des 21. Jahrhunderts – aber nur, wenn man sie richtig abfragen, strukturieren und interpretieren kann.
## Kursübersicht
Dieser Kurs bietet eine Brücke zwischen der klassischen strukturierten Datenspeicherung und modernen analytischen Auswertungstechniken. Sie erwerben praktische Kenntnisse im Schreiben von SQL-Abfragen und lernen, wie Daten für geschäftliche und technische Entscheidungen aufbereitet werden.
## Inhaltliche Schwerpunkte
1. **Relationale Datenbanksysteme (RDBMS)**: Tabellenstrukturen, Primär- und Fremdschlüssel, Normalisierung.
2. **Daten abfragen mit SQL**: SELECT-Statements, JOINs, Aggregationen (GROUP BY) und Unterabfragen.
3. **Analytische Datenbanksysteme**: Einführung in OLAP-Cubes, Stern- und Schneeflockenschemata im Data Warehouse.
4. **Praktische Datenanalyse**: Datenaufbereitung, Umgang mit fehlenden Werten und Erstellung aussagekräftiger Dashboards.
---
### Internet der Dinge
- URL: https://hackenberg.tech/courses/kurs-internet-der-dinge/
- Repository: kurs-internet-der-dinge
- Language: de
- Description: Unterlagen zu einem Kurs über das Internet der Dinge (IoT) inklusive Firmware in C# und Integration mit der IoT-Plattform Thingsboard.
- Learning Goals:
* Entwicklung von Firmware für eingebettete Systeme und IoT-Edge-Devices.
* Verwendung von Netzwerkprotokollen wie MQTT und HTTP für die IoT-Telemetrie.
* Einrichtung und Visualisierung von Sensordaten in Dashboards auf der ThingsBoard-Plattform.
Herzlich willkommen zum Kurs **Internet der Dinge (IoT)**! In diesem Modul verbinden wir die physische Welt der Sensoren mit der digitalen Welt der Cloud.
## Kursübersicht
Das IoT revolutioniert die industrielle Produktion und unseren Alltag. Sie lernen hier, wie Mikrocontroller programmiert werden, wie diese Messdaten über drahtlose und kabelgebundene Protokolle übertragen und wie diese Datenströme in einer zentralen Cloud-Plattform verarbeitet und visualisiert werden.
## Inhaltliche Schwerpunkte
1. **IoT-Architekturen**: Sensor-zu-Gateway-zu-Cloud Topologien, Edge Computing vs. Cloud Computing.
2. **Firmware-Entwicklung**: Schreiben von ressourceneffizientem Steuerungscode in C# (.NET nanoFramework / IoT APIs).
3. **Kommunikationsprotokolle**: MQTT (Publish/Subscribe-Architektur), JSON-Payloads und HTTP-Schnittstellen.
4. **IoT-Plattformen am Beispiel von ThingsBoard**: Geräteregistrierung, Rule-Engine-Konfiguration, Alarmierung und Dashboard-Erstellung.
---
### Java-Programmierung
- URL: https://hackenberg.tech/courses/kurs-java-programmierung/
- Repository: kurs-java-programmierung
- Language: de
- Description: Unterlagen für meinen Einführungskurs in die Java-Programmierung an der Fakultät für Technik und angewandte Naturwissenschaften der FH OÖ.
- Learning Goals:
* Verständnis der Kernkonzepte der objektorientierten Programmierung (OOP) wie Vererbung und Polymorphie.
* Beherrschung der Java-Syntax, Collections Framework und Ausnahmebehandlung (Exception Handling).
* Entwicklung modularer, testbarer Desktop- und Konsolenanwendungen mit Java.
Herzlich willkommen zum Kurs **Java-Programmierung**! Java gehört weltweit zu den wichtigsten und stabilsten Programmiersprachen für Unternehmenssoftware und mobile Systeme.
## Kursübersicht
Dieser Kurs richtet sich an Studierende, die solide Grundlagen in der objektorientierten Softwareentwicklung erwerben wollen. Wir betrachten sowohl theoretische Konzepte der strukturierten Programmierung als auch die praktische Umsetzung moderner Programmierparadigmen in Java.
## Inhaltliche Schwerpunkte
1. **Einführung & Syntax**: Datentypen, Kontrollstrukturen (Schleifen, Bedingungen), Arrays.
2. **Objektorientierung in der Tiefe**: Klassen, Objekte, Konstruktoren, Kapselung, Vererbung und Interfaces.
3. **Datenstrukturen**: Listen, Sets, Maps und das Java Collections Framework.
4. **Fehlerbehandlung & Input/Output**: Exceptions (try-catch), Dateiverarbeitung und Streams.
5. **Softwaretests**: Schreiben von Unit Tests mit JUnit zur automatisierten Absicherung der Codequalität.
---
### Python-Programmierung
- URL: https://hackenberg.tech/courses/kurs-python-programmierung/
- Repository: kurs-python-programmierung
- Language: de
- Description: Grundlagen der Programmierung mit der populären Skriptsprache Python. Dieses Repository bietet Unterlagen zum schnellen Erlernen von Python.
- Learning Goals:
* Verstehen der Python-Syntax, Datenstrukturen (Listen, Dictionaries) und Dateizugriffe.
* Anwendung von Kontrollstrukturen, Funktionen und modularer Skriptentwicklung.
* Praktische Problemlösung und Automatisierung von Alltagsaufgaben durch eigene Skripte.
Herzlich willkommen zum Kurs **Python-Programmierung**! Python zeichnet sich durch seine hervorragende Lesbarkeit und vielseitige Einsetzbarkeit aus.
## Kursübersicht
Dieses Modul führt Sie Schritt für Schritt in die Welt der Programmierung ein. Sie benötigen keine tiefgehenden Vorkenntnisse. Wir erlernen die grundlegenden Konzepte wie Schleifen, Bedingungen und Funktionen und wenden diese in spannenden Mini-Projekten direkt an.
## Inhaltliche Schwerpunkte
1. **Erste Schritte**: Variablen, Rechenoperationen und Zuweisungen.
2. **Datenstrukturen**: Listen, Tupel, Sets und Dictionaries effektiv nutzen.
3. **Kontrollfluss & Funktionen**: Fallunterscheidungen, Schleifen und das Schreiben wiederverwendbarer Code-Blöcke.
4. **Fehlerbehandlung**: Umgang mit Exceptions und Eingabekommentaren.
5. **Skripte & Module**: Aufteilen von Code in mehrere Dateien, Importieren von Standard-Bibliotheken (z. B. math, random, os).
---
### Software Engineering
- URL: https://hackenberg.tech/courses/kurs-software-engineering/
- Repository: kurs-software-engineering
- Language: de
- Description: Praxisorientierter Einsteigerkurs in das Software Engineering. Lernen Sie agile Methoden, UML-Design und automatisierte Tests in C# kennen.
- Learning Goals:
* Beherrschen agiler Methoden (Scrum, Kanban) und Phasen des Software-Lebenszyklus.
* Entwurf robuster Systemarchitekturen unter Verwendung von UML-Diagrammen und Design Patterns.
* Qualitätssicherung durch automatisiertes Testen (Unit Tests, Integrationstests) in C#.
Herzlich willkommen zum Kurs **Software Engineering**! Softwareentwicklung ist weit mehr als nur Code zu schreiben – es ist ein strukturierter Ingenieursprozess zur Lösung komplexer Probleme.
## Kursübersicht: Software Engineering an der FH Oberösterreich
Der Hochschulkurs **Software Engineering** von Dr. Georg Hackenberg vermittelt die methodischen und technischen Grundlagen zur industriellen Softwareentwicklung. Studierende lernen systematisch, wie komplexe Softwaresysteme von der Anforderungsanalyse über die modellgetriebene Architektur bis hin zu automatisierter Qualitätssicherung in C# und CI/CD-Pipelines engineered werden.
## Was lernen Sie im Kurs Software Engineering?
Die Lehrveranstaltung verbindet agile Vorgehensmodelle mit soliden ingenieurmäßigen Softwarearchitekturen. Anhand durchgängiger praktischer Programmierprojekte erarbeiten Sie wartbare, skalierbare und testbare Systeme:
1. **Softwareprozessmodelle**: Phasenorientiertes Vorgehen, Scrum-Framework, Sprint-Planung, User Stories und Kanban.
2. **Objektorientierter Entwurf (OOD)**: Modellierung mit UML-Klassendiagrammen, Sequenzdiagrammen und Use-Case-Spezifikationen.
3. **Entwurfsmuster (Design Patterns)**: Praxisnahe Umsetzung von Gang-of-Four-Mustern wie Singleton, Factory, Observer, Adapter und MVC.
4. **Clean Code & Refactoring**: Wartbarkeitstechniken, SOLID-Prinzipien, Erkennung und Beseitigung technischer Schulden.
5. **Automatisiertes Testen**: Test-Driven Development (TDD), Unit Tests und Mocking mit NUnit in modernem C#/.NET.
6. **Versionsverwaltung & CI/CD**: Verteilte Entwicklung mit Git (Feature Branching, Code Reviews) und automatisierte GitHub Actions Builds.
## Curriculum & Modulübersicht
Die folgende Tabelle gibt einen Überblick über die Kernmodule, behandelte Methoden und die eingesetzten Entwicklungswerkzeuge:
| Modul | Themen & Methoden | Werkzeuge & Technologien |
| :--- | :--- | :--- |
| **1. Agiles Vorgehen** | Scrum, Sprint Backlog, User Story Mapping, Retrospektiven | Jira, GitHub Projects, Markdown |
| **2. Systemarchitektur** | Domain-Driven Design (DDD), Komponentenarchitektur, UML | Draw.io, Mermaid.js, PlantUML |
| **3. Objektorientierung** | Clean Architecture, SOLID-Prinzipien, Design Patterns | C#, Visual Studio, Rider |
| **4. Testautomatisierung** | Unit Tests, TDD-Zyklus (Red-Green-Refactor), Mocking | NUnit, Moq, FluentAssertions |
| **5. Build & Deployment** | Continuous Integration, Static Code Analysis, Linter | Git, GitHub Actions, SonarQube |
## Häufig gestellte Fragen (FAQ)
### An wen richtet sich dieser Kurs?
Der Kurs richtet sich primär an Bachelor-Studierende der Fachrichtung Informatik und verwandter technischer Studiengänge an der FH Oberösterreich sowie an Softwareentwickler, die ihre Grundlagen in systematischer Architektur und Testautomatisierung vertiefen möchten.
### Welche Vorkenntnisse sind erforderlich?
Grundlegende Programmierkenntnisse in einer modernen objektorientierten Sprache (wie C#, Java, C++ oder TypeScript) sowie Verständnis grundlegender Kontrollstrukturen und Datenstrukturen werden vorausgesetzt.
### Sind die Lehrmaterialien und Code-Beispiele öffentlich zugänglich?
Ja, alle zugehörigen Vorlesungsunterlagen, Folien und lauffähigen C#-Code-Beispiele stehen im verlinkten Open-Source GitHub Repository zur freien Verfügung und können für das Selbststudium genutzt werden.
---
### Systems Engineering
- URL: https://hackenberg.tech/courses/kurs-systems-engineering/
- Repository: kurs-systems-engineering
- Language: de
- Description: Unterlagen für meinen Kurs in Systems Engineering mit MATLAB und Simulink an der Fakultät für Technik und angewandte Naturwissenschaften der FH OÖ.
- Learning Goals:
* Verstehen der Prinzipien des Model-Based Systems Engineering (MBSE).
* Erstellung mathematischer Simulationsmodelle in MATLAB und Simulink.
* Regelungsentwurf und Stabilitätsanalyse mechatronischer Systeme.
Herzlich willkommen zum Kurs **Systems Engineering**! Bei der Entwicklung komplexer physikalisch-digitaler Systeme ist die interdisziplinäre Systemsicht unerlässlich.
## Kursübersicht
Wir fokussieren uns in diesem Kurs auf die modellbasierte Systementwicklung (Model-Based Systems Engineering). Unter Verwendung der Industriestandards MATLAB und Simulink lernen Sie, physikalische Prozesse (Mechanik, Elektrik) mathematisch zu modellieren, Regelungskonzepte zu entwerfen und das Gesamtverhalten im Zeit- und Frequenzbereich zu simulieren.
## Inhaltliche Schwerpunkte
1. **Einführung in Systems Engineering**: V-Modell, Systemgrenzen, funktionale Architekturen.
2. **Mathematische Systemmodellierung**: Differentialgleichungen mechatronischer Systeme, Übertragungsfunktionen.
3. **Simulink-Modellierung**: Blockdiagramme, kontinuierliche und diskrete Simulation, Solver-Einstellungen.
4. **Regelungstechnik**: PID-Regler Entwurf, Feedback-Schleifen und Stabilitätsbewertungen.
5. **Systemanalyse**: Frequenzkennlinien (Bode-Diagramme) und Sprungantworten auswerten.
---
### Web-Programmierung mit TypeScript
- URL: https://hackenberg.tech/courses/kurs-typescript-firebase/
- Repository: kurs-typescript-firebase
- Language: de
- Description: Unterlagen für meinen Kurs in Web-Programmierung mit TypeScript und Firebase. Einstieg in die moderne Webentwicklung.
- Learning Goals:
* Sichere Anwendung von TypeScript-Features wie statischer Typisierung und Interfaces im Webkontext.
* Integration einer Cloud-Datenbank (Google Cloud Firestore) und Authentifizierung in Web-Apps.
* Erstellung und Bereitstellung interaktiver Single-Page-Anwendungen (SPAs) auf Firebase Hosting.
Herzlich willkommen zum Kurs **Web-Programmierung mit TypeScript & Firebase**! Moderne Web-Anwendungen erfordern robuste Programmiersprachen und flexible Cloud-Backends.
## Kursübersicht
Dieser Kurs führt Sie in die moderne Full-Stack Webentwicklung ein. Als Programmiersprache nutzen wir TypeScript, um Typsicherheit und Wartbarkeit in JavaScript-Projekten zu garantieren. Als Backend-as-a-Service (BaaS) nutzen wir Google Firebase, wodurch wir ohne eigenen Server-Verwaltungsaufwand Echtzeitdatenbanken, Benutzerregistrierung und Hosting integrieren können.
## Inhaltliche Schwerpunkte
1. **TypeScript Grundlagen**: Kompilierung, Typdefinitionen, Interfaces, Generics und ES6+ Features.
2. **Web-Grundlagen & DOM-Manipulation**: Strukturierte Interaktion mit HTML5, CSS3-Layouts und Event-Handling.
3. **Firebase Authentication**: Benutzerregistrierung, Login-Statusverwaltung und Sicherheitsregeln (Rules).
4. **Cloud Firestore Datenbank**: Dokumentenbasierte NoSQL-Strukturen, Echtzeit-Listener und CRUD-Operationen.
5. **Firebase Hosting & Deployment**: Build-Prozesse, Konfiguration von Weiterleitungen und Veröffentlichung der App.
---
## 6. Software Projects & Systems
### CADdrive
- URL: https://hackenberg.tech/projects/caddrive/
- External Link: https://caddrive.org
- Tagline: Product Design Platform
- Description: CADdrive is a web-based, collaborative product design platform for schools and universities, lowering the learning curve for CAD and team engineering.
- Technologies: cad, collaborative-software, education, open-source, product-design, systems-engineering, web-development
undefined
---
### Delta Dynamics
- URL: https://hackenberg.tech/projects/delta-dynamics/
- External Link: https://dd.hackenberg.tech
- Tagline: Ecosystem Simulator
- Description: Low-poly ecosystem simulator featuring real-time dynamic terrain, GPU-accelerated water flow, resource management, and local LLM-driven AI behaviors.
- Technologies: agentic-ai, artificial-intelligence, gpgpu, local-ai, react, shaders, simulation, threejs, web-llm, webgl
undefined
---
### Mentawise
- URL: https://hackenberg.tech/projects/mentawise/
- External Link: https://mentawise.com
- Tagline: Knowledge Graph Visualizer
- Description: Mentawise is an innovative knowledge management solution letting visual thinkers quickly build personal knowledge graphs and share them instantly with others.
- Technologies: collaborative-software, data-visualization, graph-database, knowledge-graphs, knowledge-management, mind-mapping, saas
undefined
---
### SpineML
- URL: https://hackenberg.tech/projects/spineml/
- External Link: https://github.com/ghackenberg/SpineML
- Tagline: Layout & Simulation Toolkit
- Description: A Python toolkit designed to optimize factory layout planning (FLP) and job shop scheduling (JSS) through advanced layout modeling and simulation.
- Technologies: data-visualization, factory-layout, manufacturing-systems, open-source, optimization, python, scheduling, simulation
undefined
---
## 7. Business Services & Modules
### Service: Content Engineering
- URL: https://hackenberg.tech/services/content-engineering/
- Tagline: Structured Content Architectures, Design Tokens & Automated Git Pipelines
- Description: End-to-end consulting for scalable digital content operations. From formal Zod schemas and omnichannel syndication to multi-format design systems and automated Astro CI/CD pipelines.
### Service: Intelligence Engineering
- URL: https://hackenberg.tech/services/intelligence-engineering/
- Tagline: Sovereign Agent Architectures, Enterprise Infrastructure & Autonomous Workflows
- Description: End-to-end consulting for sovereign enterprise AI systems. From private model serving and hybrid knowledge retrieval to standardized tool protocols and stateful multi-agent orchestration.
### Module: Channel Architecture
- Tagline: Omnichannel Syndication & Hub-and-Spoke Workflows
- Description: Architecting 'Create Once, Publish Everywhere' (COPE) syndication pipelines connecting canonical web documentation with LinkedIn carousels, video walkthroughs, and developer hubs.
- Key Highlights:
* Audience segmentation and distinct editorial strategy definition per communication channel
* Hub-and-spoke content syndication pipelines transforming core research into derivative formats
* Canonical SEO attribution frameworks and cross-platform synchronization rules
* Multi-platform presence architecture across web, docs, LinkedIn, YouTube, and developer hubs
## Strategic Clarity Across Multi-Platform Channels
Broadcasting generic messages across platforms leads to audience fatigue, while operating disparate channels in silos creates duplicated effort and conflicting brand messaging.
My Channel Architecture consulting establishes a disciplined **"Create Once, Publish Everywhere" (COPE)** distribution model that maximizes operational leverage.
### The Hub-and-Spoke Syndication Model
We treat your owned web platform and documentation as the definitive, canonical source of truth (the Hub). From this primary artifact, structured workflows derive platform-optimized assets (the Spokes): executive visual carousels for LinkedIn, quick changelogs for developer communities, and deep-dive video scripts.
### Canonical Attribution & SEO Integrity
We engineer strict canonical link references and structured cross-references to ensure search engines recognize your core platform as the authoritative origin, amplifying organic authority across all touchpoints.
---
### Module: Design Systems
- Tagline: Design Tokens, Component Kits & Social Templates
- Description: Engineering unified design tokens, component kits, and multi-format social templates (1:1, 16:9, 4:5) for unmistakable brand recognition across web and social media.
- Key Highlights:
* Design system architecture specifically engineered for social media and technical publishing
* Modular template libraries for technical infographics, carousels, thumbnails, and quote cards
* Design tokens (color ramps, typography scales, contrast ratios) unified across web and social
* Establishing a cohesive, memorable visual brand language that elevates brand recognition
## Building an Unmistakable Visual Identity
In modern digital feeds, visual impressions form in fractions of a second. Organizations producing inconsistent, ad-hoc graphics dilute brand equity and fail to capture executive attention. High-impact content demands a systematic visual language that makes your insights instantly recognizable.
My Design Systems practice engineers comprehensive visual token architectures specifically tailored for technical and professional content.
### Purpose-Built for Multi-Format Distribution
Unlike static PDF brand guides, our design systems are engineered directly for real-world content production:
- **Aspect Ratio Mastery**: Reusable component grids optimized for square (1:1), vertical feed (4:5), and widescreen video (16:9) formats.
- **Technical Visualization**: Standardized styling for architectural diagrams, code snippets, benchmark charts, and executive quote cards.
- **Educational Carousels**: Multi-slide narrative templates designed for smooth swipe progression and high dwell time on platforms like LinkedIn.
---
### Module: Content Modeling
- Tagline: Structured Schemas, Typed Collections & Taxonomies
- Description: Designing formal Zod content schemas, type-safe content collections, entity-relationship models, and controlled topic taxonomies that eliminate unstructured text blobs.
- Key Highlights:
* Formal schema modeling with strict Zod / JSON Schema build-time type validation
* Modular component architecture breaking unstructured articles into reusable typed blocks
* Controlled taxonomy vocabularies, tag hierarchies, and entity-relationship mapping
* Database-agnostic headless content architectures ready for Git or Headless CMS storage
## Eliminating Text Blobs with Structured Content Modeling
Traditional content management treats articles as massive, unstructured blobs of HTML or rich text. This creates fragile layouts, makes programmatic reuse across devices impossible, and invites broken metadata.
My Content Modeling practice transforms unstructured prose into modular, strictly typed data structures validated at build time.
### Strict Type Validation with Zod
By defining content models as formal Zod schemas, every publication date, author relationship, and metadata tag is verified during compilation. Typos and schema mismatches break the build before reaching production.
### Entity-Relationship Architecture
We structure content entities into interconnected graphs—linking articles to authors, technologies, courses, and related services through type-safe foreign keys and tag references.
---
### Module: Publishing Pipelines
- Tagline: Astro/MDX Static Engines, Programmatic Assets & CI/CD
- Description: Engineering blazing-fast static-site architectures with Astro and MDX, programmatic asset rendering (WebP/AVIF), automated sitemaps, and zero-downtime Git CI/CD delivery.
- Key Highlights:
* Modern static-site generation pipelines using Astro, MDX, and structured collections
* Programmatic media optimization: WebP/AVIF compression and responsive image sets
* Automated Git-driven continuous integration (CI) and global CDN deployments
* Zero-downtime releases, rollback reliability, and automated asset verification
## Engineering High-Velocity, Git-Driven Publishing Pipelines
Traditional content management systems are fraught with database vulnerabilities, sluggish page loads, and fragile plugin ecosystems. High-velocity engineering organizations require content architectures that treat prose and digital assets with the same rigorous version control, automated testing, and CI/CD pipelines as production software.
My Publishing Pipelines consulting delivers modern, automated publishing pipelines powered by **Astro**, **MDX**, and **Git-driven CI/CD**.
### Zero-JavaScript Performance with Astro
By compiling Markdown and MDX into zero-JavaScript static HTML by default, your publishing platforms achieve 100/100 Lighthouse performance scores and instantaneous page transitions with zero client-side hydration bloat.
### Programmatic Media Optimization and CI/CD
Publishing velocity should never be hindered by manual image resizing. We engineer automated build scripts that convert raw imagery into responsive WebP/AVIF sets, sanitize vector graphics, and deploy globally via automated GitHub Actions in seconds.
---
### Module: Semantic Optimization
- Tagline: Schema.org Microdata, Knowledge Graphs & AI Discovery
- Description: Engineering structured Schema.org JSON-LD microdata, automated LLM context manifests (content-manifest.json), XML sitemaps, and knowledge graph discoverability for modern search engines and AI agents.
- Key Highlights:
* Deep Schema.org JSON-LD structured data integration (Articles, Services, Breadcrumbs, Persons)
* Automated plain-text LLM context manifest generators for AI search indexing
* Multi-sitemap architectures with priority tagging and automated RSS discovery feeds
* Semantic entity linking establishing high topical authority in knowledge graphs
## Machine Readability for the Age of AI Search
Traditional SEO centered on keyword stuffing is obsolete. In modern digital discovery, both traditional search engines (Google) and AI answer engines (Perplexity, SearchGPT, Gemini) rely on structured data, knowledge graphs, and semantic entity clarity to understand and cite your work.
My Semantic Optimization consulting engineers deep machine-readability directly into your digital publishing platform.
### Rich Schema.org JSON-LD Microdata
We integrate comprehensive JSON-LD schemas across your platform—explicitly defining Services, Articles, Persons, Courses, and Breadcrumbs. This eliminates ambiguity and establishes strong topical authority in search engine knowledge graphs.
### LLM Context Manifests & Multi-Sitemaps
We build automated build-time generators that produce plain-text LLM context manifests (like content-manifest.json) and structured XML sitemaps, ensuring autonomous AI agents can ingest, index, and cite your publications without hallucination.
---
### Module: System Observability
- Tagline: Generative UI Steering, Real-Time Telemetry & Guardrails
- Description: Engineering ergonomic front-end steering interfaces with dynamic Generative UI widgets, explicit human-in-the-loop approval gates, distributed tracing, token accounting, and automated regression guardrails.
- Key Highlights:
* Interactive Generative UI components rendered dynamically inline for actionable proposals
* Explicit human-in-the-loop steering controls, granular step editing, and confirmation gates
* Real-time distributed telemetry: token throughput, cost tracking, and latency deconstruction
* Continuous evaluation harnesses, regression benchmarks, and automated hallucination guardrails
## Operational Control, Transparency & Deep Telemetry
Deploying autonomous intelligence in mission-critical environments demands rigorous observability and intuitive human oversight. Organizations cannot rely on black-box systems without real-time insights into token costs, latency bottlenecks, and output quality.
My System Observability practice couples deep telemetry instrumentation with ergonomic human-in-the-loop steering interfaces.
### Ergonomic Human-in-the-Loop & Generative UI
Trust is built on transparency:
- **Generative UI Widgets**: Rich, interactive UI components rendered dynamically inline to present structured proposals, diffs, and controls.
- **Explicit Steering Gates**: Clean confirmation modals, granular editability of intermediate agent steps, and instantaneous cancellation.
- **Reasoning Traces**: Collapsible, informative activity logs that show users what tools the agent executed and why.
### Distributed Telemetry & Automated Quality Guardrails
We instrument complete operational transparency:
- **Latency Breakdown**: Deconstructing time-to-first-token (TTFT), tool execution duration, and end-to-end task completion times.
- **Token Accounting**: Real-time attribution of prompt, completion, and cache tokens across users and workflows.
- **Continuous Evaluation**: Automated testing harnesses evaluating accuracy, schema compliance, and hallucination rates against ground-truth datasets.
---
### Module: Agentic Orchestration
- Tagline: Cyclic State Graphs, Dynamic Delegation & Checkpoints
- Description: Architecting multi-agent collaboration networks as stateful, cyclic graphs using LangGraph, featuring dynamic supervisor-worker delegation, consensus arbitration, and persistent pause/resume states.
- Key Highlights:
* Stateful cyclic graph workflows engineered in LangGraph (loops, critique, refinement)
* Supervisor-worker and peer-to-peer multi-agent coordination architectures
* Fault-tolerant checkpointing allowing long-running operations to pause for human approval
* Dynamic task delegation, schema validation handoffs, and arbitration protocols
## Beyond Linear Prompt Chains: Stateful Multi-Agent Graphs
Complex enterprise workflows cannot be solved by single-turn prompts or rigid linear chains. Real-world tasks require agents to evaluate partial results, loop back to correct mistakes, delegate specialized tasks, and pause for human oversight.
My Agentic Orchestration consulting models autonomous workflows as stateful, cyclic graphs engineered with **LangGraph**.
### Cyclic Execution & Self-Correction
Unlike brittle DAG pipelines, LangGraph allows agents to loop, critique, and refine work iteratively before finalizing outputs. This enables deep reasoning and self-healing under unexpected tool failures.
### Multi-Agent Coordination Patterns
We partition complex business challenges across specialized agents (researchers, coders, arbiters, validators). Through structured supervisor-worker or peer-to-peer topologies, each agent operates within a bounded scope, drastically reducing context saturation and hallucination.
### Fault-Tolerant Checkpointing
Using persistent checkpoint stores, long-running agentic workflows can pause for minutes or days awaiting human sign-off, and resume instantaneously without loss of state.
---
### Module: Knowledge Retrieval
- Tagline: Dense Vector Search, Neo4j Knowledge Graphs & Memory
- Description: Engineering hallucination-resistant retrieval architectures combining dense semantic search (Qdrant), property knowledge graphs (Neo4j GraphRAG), and continuous agent memory (Mem0).
- Key Highlights:
* Hybrid GraphRAG combining relational enterprise knowledge with dense semantic vector search
* Sub-millisecond vector indexing, payload filtering, and dense embeddings powered by Qdrant
* Contextual property knowledge graphs modeled and queried via Neo4j
* Persistent, personalized agent memory and dynamic context injection implemented via Mem0
## Grounding Intelligence in Enterprise Reality
Autonomous intelligence requires rich, verifiable enterprise context. Simple keyword search and naive vector similarity frequently hallucinate or fail to understand interconnected business entities.
My Knowledge Retrieval practice delivers hybrid retrieval-augmented generation (RAG) that pairs dense semantic embeddings with the structural rigor of property knowledge graphs.
### Dense Vector Search with Qdrant
Using **Qdrant**, we achieve sub-millisecond similarity search across millions of documents. We configure advanced payload filtering, quantization, and hybrid sparse-dense embeddings to ensure high retrieval precision.
### Relational Context with Neo4j Knowledge Graphs
Business knowledge is inherently relational. By modeling enterprise data in **Neo4j**, agents can traverse multi-hop relationships between products, departments, contracts, and regulations—unlocking true GraphRAG reasoning.
### Continuous Agent Memory with Mem0
Agents must retain context across conversations. With **Mem0**, we equip agents with long-term memory that adapts to user preferences and preserves organizational continuity.
---
### Module: Model Serving
- Tagline: High-Throughput Private Inference, API Gateways & Security
- Description: Designing and deploying enterprise-grade sovereign AI inference clusters powered by vLLM, unified LiteLLM Proxy routing, spending controls, and Keycloak SSO/RBAC.
- Key Highlights:
* High-throughput, low-latency private model inference powered by vLLM tensor parallelism
* Sovereign open-weights deployment (Hermes, Llama, DeepSeek, Qwen) with zero cloud data egress
* Unified enterprise API gateway with model routing, fallback cascades, and token budgeting via LiteLLM
* Hardened enterprise identity governance and role-based access control (RBAC) via Keycloak
## Sovereign Compute for Mission-Critical AI
Building enterprise-grade AI capabilities requires moving beyond fragmented scripts and unvetted commercial SaaS APIs. A dependable system demands a standardized, sovereign technology stack where inference speed, compute costs, and enterprise data privacy operate under full organizational sovereignty.
My Model Serving consulting designs and implements a production-ready, open-source AI platform tailored to the sovereignty, governance, and latency requirements of modern enterprises.
### High-Throughput Inference with vLLM
At the core of the compute tier, **vLLM** delivers state-of-the-art throughput and minimal time-to-first-token (TTFT). Utilizing PagedAttention, continuous batching, and tensor parallelism across modern accelerators (NVIDIA/AMD), vLLM serves open models at enterprise scale with sovereign control over weights and proprietary data.
### Unified Gateway Governance with LiteLLM & Keycloak
Enterprise integration requires strict operational oversight and secure access:
- **LiteLLM Proxy**: A centralized API gateway providing model routing, fallback cascades, load balancing, spending caps, and token telemetry across all private and hybrid model endpoints.
- **Keycloak**: Securing endpoints with industry-standard Single Sign-On (SSO), OpenID Connect (OIDC), and granular Role-Based Access Control (RBAC).
---
### Module: Tool Integration
- Tagline: Model Context Protocol (MCP), WikiSkills & Enterprise APIs
- Description: Connecting autonomous agent runtimes (Nous Hermes) to enterprise databases, ERPs, and cloud APIs through standardized Model Context Protocol (MCP) servers and deterministic schema validation.
- Key Highlights:
* Universal Model Context Protocol (MCP) server engineering for internal tools and databases
* Autonomous function calling and deterministic multi-turn loops powered by Nous Hermes
* Declarative capability specifications standardized on the Google WikiSkills / Agent Skills format
* Deterministic runtime schema validation and structured error recovery via Zod / Pydantic
## Unifying Open Tool Protocols with Enterprise Systems
Autonomous AI agents cannot operate as isolated chatbots. To deliver tangible enterprise value, models must safely read and write to internal systems—querying SQL databases, triggering ERP workflows, and dispatching API calls through open, standardized protocols.
My Tool Integration practice establishes deterministic, vendor-independent capability layers founded on the **Model Context Protocol (MCP)** and declarative tool contracts.
### The Model Context Protocol (MCP) Standard
By adopting the open Model Context Protocol (MCP), we eliminate fragile prompt-specific glue code. We construct modular MCP servers that expose your enterprise data and business actions through standardized, self-describing interfaces that any frontier agent can execute.
### The Hermes Agent Ecosystem & Declarative Skills
We leverage the **Nous Hermes** agent runtime for deterministic schema adherence and structured function calling, organizing capabilities into declarative, modular **Google WikiSkills** complete with explicit input contracts, validation constraints, and execution examples.
---
## 8. Knowledge Index & Topic Tags
### #Academic Teaching & Pedagogy
- URL: https://hackenberg.tech/tags/teaching/
- Description: Instructional methodologies, student project coaching, and laboratory course design at the university level.
### #Agentic AI
- URL: https://hackenberg.tech/tags/agentic-ai/
- Description: Autonomous software agents combining reasoning, multi-turn tool execution, and goal-directed decision architectures.
### #AI Migration
- URL: https://hackenberg.tech/tags/ai-migration/
- Description: Architectural workflows, tooling, and refactoring strategies for transitioning legacy software systems and data pipelines to modern AI-assisted stacks.
### #AI Optimization
- URL: https://hackenberg.tech/tags/aio/
- Description: Algorithmic tuning, token-efficiency engineering, and latency reduction techniques for generative AI and large language models.
### #Almtal Project
- URL: https://hackenberg.tech/tags/almtal/
- Description: Regional innovation, digital transformation, and sustainable infrastructure initiatives focused on the Almtal valley in Upper Austria.
### #Answer Engine Optimization
- URL: https://hackenberg.tech/tags/aeo/
- Description: Strategies and technical methodologies for structuring content to optimize discovery and citation by AI-powered answer engines and LLM search agents.
### #Artificial Intelligence
- URL: https://hackenberg.tech/tags/artificial-intelligence/
- Description: Foundational principles, symbolic reasoning, and deep learning architectures for developing intelligent, adaptive software systems.
### #Astro
- URL: https://hackenberg.tech/tags/astro/
- Description: Modern web development framework featuring content collections, zero-JS by default, and isolated component islands.
### #Awards & Honors
- URL: https://hackenberg.tech/tags/award/
- Description: Academic recognitions, competition prizes, and industry accolades received for excellence in research, teaching, and software engineering.
### #Benchmarks & Performance
- URL: https://hackenberg.tech/tags/benchmarks/
- Description: Empirical measurement, profiling, and comparative performance evaluations of software algorithms, graphics pipelines, and execution runtimes.
### #Blog & Editorial
- URL: https://hackenberg.tech/tags/blog/
- Description: Reflections, technical tutorials, engineering notes, and behind-the-scenes insights on computer science and technology.
### #Calm Technology
- URL: https://hackenberg.tech/tags/calm-technology/
- Description: Design philosophy where technology informs and serves users naturally without demanding unneeded attention or increasing cognitive overhead.
### #Civil Engineering
- URL: https://hackenberg.tech/tags/civil-engineering/
- Description: Applications of computational modeling, structural simulation, and sensor telemetry within civil infrastructure and the built environment.
### #Cognitive Ergonomics
- URL: https://hackenberg.tech/tags/cognitive-ergonomics/
- Description: Study of mental processes, cognitive load, and human decision-making constraints in the design of software interfaces and digital tools.
### #Cognitive Science
- URL: https://hackenberg.tech/tags/cognitive-science/
- Description: Interdisciplinary study of mind, intelligence, and cognitive models informing user experience and human-centric software.
### #Collaborative Software
- URL: https://hackenberg.tech/tags/collaborative-software/
- Description: Real-time multi-user synchronization, state reconciliation, and collaborative workspace architectures.
### #Computer Graphics
- URL: https://hackenberg.tech/tags/computer-graphics/
- Description: Algorithms and rendering techniques for 2D and 3D visual synthesis, rasterization, and vector transformations.
### #Computer Science Education
- URL: https://hackenberg.tech/tags/education/
- Description: Higher education pedagogy, practical curricula, and laboratory coursework in software engineering and industrial informatics taught at the University of Applied Sciences Upper Austria.
### #Computer Simulation & Modeling
- URL: https://hackenberg.tech/tags/simulation/
- Description: Numerical, discrete-event, and agent-based simulation models replicating real-world physical and operational phenomena.
### #Computer Vision
- URL: https://hackenberg.tech/tags/computer-vision/
- Description: Visual perception algorithms, image processing pipelines, and feature extraction systems for extracting high-level understanding from digital media.
### #Computer-Aided Design (CAD)
- URL: https://hackenberg.tech/tags/cad/
- Description: Software systems, geometric representation standards, and algorithms for creating, editing, and managing technical engineering designs.
### #Conferences & Symposia
- URL: https://hackenberg.tech/tags/conference/
- Description: Scientific conference presentations, peer-reviewed workshop sessions, and keynotes delivered at leading academic venues.
### #Content Engineering
- URL: https://hackenberg.tech/tags/content-engineering/
- Description: Structured content modeling, omnichannel channel architecture, design systems, automated publishing pipelines, and semantic optimization.
### #Cyberpsychology
- URL: https://hackenberg.tech/tags/cyberpsychology/
- Description: Analysis of human psychological dynamics, attention patterns, and behavioral responses when interacting with digital software and online media.
### #Cytoscape.js
- URL: https://hackenberg.tech/tags/cytoscape/
- Description: Graph analysis and network visualization library for complex relationship mapping and computational biology.
### #D3.js
- URL: https://hackenberg.tech/tags/d3/
- Description: Data-driven document manipulation and custom SVG/HTML rendering for rich interactive data visualizations.
### #Data Integration
- URL: https://hackenberg.tech/tags/data-integration/
- Description: Architectures, ETL pipelines, and semantic mapping techniques for combining heterogeneous data sources into unified operational views.
### #Data Visualization
- URL: https://hackenberg.tech/tags/data-visualization/
- Description: Visual encoding techniques, graphical displays, and interactive visual analytics for understanding complex datasets and processes.
### #Depth Anything
- URL: https://hackenberg.tech/tags/depth-anything/
- Description: Monocular depth estimation models and architectures for robust metric and relative 3D scene reconstruction.
### #Design Systems
- URL: https://hackenberg.tech/tags/design-systems/
- Description: Modular design tokens, component libraries, visual style specifications, and deterministic cross-platform UI architectures.
### #DevOps & CI/CD
- URL: https://hackenberg.tech/tags/devops/
- Description: Automated deployment pipelines, containerization, reproducible builds, and developer infrastructure operations.
### #Diffusion Models
- URL: https://hackenberg.tech/tags/diffusion-models/
- Description: Latent diffusion architectures, cross-attention conditioning, denoising processes, and spatial image generation.
### #Digital Engineering
- URL: https://hackenberg.tech/tags/digital-engineering/
- Description: Model-based systems engineering, digital asset graphs, structured ontologies, and automated computational workflows.
### #Dynamic Programming
- URL: https://hackenberg.tech/tags/dynamic-programming/
- Description: Algorithmic optimization techniques solving complex problems by recursively breaking them down into overlapping subproblems.
### #Energy Systems
- URL: https://hackenberg.tech/tags/energy-systems/
- Description: Modeling, simulation, and predictive optimization of renewable energy grids, battery storage, and distributed power architectures.
### #Enterprise AI
- URL: https://hackenberg.tech/tags/enterprise-ai/
- Description: Strategic integration of sovereign artificial intelligence architectures, governance, and compliant automation within large-scale business operations.
### #Ergonomics & Human Factors
- URL: https://hackenberg.tech/tags/ergonomics/
- Description: Designing workstations, interfaces, and physical interaction systems to match human physiological and psychological capabilities.
### #Factory Layout Planning
- URL: https://hackenberg.tech/tags/factory-layout/
- Description: Spatial optimization, automated flow simulation, and digital twins for industrial manufacturing plant layouts.
### #Generative AI
- URL: https://hackenberg.tech/tags/generative-ai/
- Description: Generative artificial intelligence, image synthesis, latent diffusion models, multimodality, and deterministic visual systems.
### #Generative Engine Optimization (GEO)
- URL: https://hackenberg.tech/tags/geo/
- Description: Architectures, retrieval-augmented generation (RAG) readiness, semantic citation engineering, and visibility optimization for generative AI search engines.
### #Gesture Recognition
- URL: https://hackenberg.tech/tags/gesture-recognition/
- Description: Real-time computer vision and machine learning models for tracking, decoding, and interpreting human hand and body movements.
### #GitHub Pages
- URL: https://hackenberg.tech/tags/github-pages/
- Description: Static website hosting, automated GitHub Actions deployments, and open-source documentation publishing.
### #GLSL & Compute Shaders
- URL: https://hackenberg.tech/tags/shaders/
- Description: High-performance GPU shader code for real-time procedural rendering, image filters, and physical simulations.
### #Google Gemini
- URL: https://hackenberg.tech/tags/gemini/
- Description: Multimodal foundation models, prompt architecture, and agent integrations utilizing Google Gemini APIs.
### #GPGPU Computing
- URL: https://hackenberg.tech/tags/gpgpu/
- Description: Massively parallel compute shaders and general-purpose GPU processing for high-performance numerical algorithms.
### #Graph Databases
- URL: https://hackenberg.tech/tags/graph-database/
- Description: Data storage, traversal, and indexing architectures modeled around nodes, edges, and semantic graph relationships.
### #Hardware & Embedded Systems
- URL: https://hackenberg.tech/tags/hardware/
- Description: Microcontrollers, sensor interfaces, embedded communication buses, and physical compute hardware.
### #Hermes Agent
- URL: https://hackenberg.tech/tags/hermes-agent/
- Description: Open-source, self-hosted autonomous AI agent runtime and operating system developed by Nous Research.
### #Human-Computer Interaction (HCI)
- URL: https://hackenberg.tech/tags/human-computer-interaction/
- Description: Design and scientific evaluation of interfaces that foster intuitive, reliable communication between humans and computers.
### #Humane Technology
- URL: https://hackenberg.tech/tags/humane-tech/
- Description: Digital tools and software architectures intentionally engineered to protect attention, mental health, and human dignity.
### #Hydrology & Water Systems
- URL: https://hackenberg.tech/tags/hydrology/
- Description: Computational modeling, water cycle simulation, and sensor-driven resource management in hydrological systems.
### #Hyperkit Software
- URL: https://hackenberg.tech/tags/hyperkit-software/
- Description: Architecture, development, and tool ecosystem surrounding the Hyperkit software suite and visualization utilities.
### #Industrial Informatics
- URL: https://hackenberg.tech/tags/industrial-informatics/
- Description: Convergence of software engineering, cyber-physical systems, and digital automation within manufacturing and industry.
### #Innovation & Technology Transfer
- URL: https://hackenberg.tech/tags/innovation/
- Description: Translating academic research discoveries into viable commercial software products, startups, and applied industrial solutions.
### #Intelligence Engineering
- URL: https://hackenberg.tech/tags/intelligence-engineering/
- Description: Sovereign AI systems, model serving, knowledge retrieval, agentic orchestration, and operational observability.
### #Internet of Things (IoT)
- URL: https://hackenberg.tech/tags/iot/
- Description: Connected sensor networks, edge compute devices, and telemetry collection pipelines for smart industrial environments.
### #Java
- URL: https://hackenberg.tech/tags/java/
- Description: Object-oriented programming, enterprise software architectures, design patterns, and JVM ecosystem development.
### #JavaScript
- URL: https://hackenberg.tech/tags/javascript/
- Description: Language ecosystem, runtime performance optimization, and browser APIs powering modern client-side and full-stack software.
### #Keycloak Identity & Access
- URL: https://hackenberg.tech/tags/keycloak/
- Description: Open-source identity and access management solution providing modern Single Sign-On (SSO), OAuth 2.0, and OpenID Connect security.
### #Knowledge Graphs
- URL: https://hackenberg.tech/tags/knowledge-graphs/
- Description: Semantic network representations linking entities, concepts, and relationships to empower machine reasoning and retrieval.
### #Knowledge Management
- URL: https://hackenberg.tech/tags/knowledge-management/
- Description: Systems and structured methodologies for capturing, organizing, and retrieving organizational knowledge and research insight.
### #LangGraph
- URL: https://hackenberg.tech/tags/langgraph/
- Description: Cyclic computational graph framework for building robust, multi-actor stateful agent workflows and long-running reasoning loops.
### #LiteLLM
- URL: https://hackenberg.tech/tags/litellm/
- Description: Universal open-source AI gateway, proxy, and router for unified LLM APIs, load balancing, caching, and governance.
### #Local AI & On-Device Models
- URL: https://hackenberg.tech/tags/local-ai/
- Description: Deploying, quantizing, and running language models directly on local client hardware with full privacy and zero cloud dependency.
### #Local-First Architecture
- URL: https://hackenberg.tech/tags/local-first/
- Description: Software design paradigm prioritizing client-side data ownership, offline capability, and background peer synchronization.
### #LocalStorage & Client Storage
- URL: https://hackenberg.tech/tags/localstorage/
- Description: Client-side web storage mechanisms, caching strategies, and resilient offline state persistence.
### #Machine Learning
- URL: https://hackenberg.tech/tags/machine-learning/
- Description: Statistical algorithms, supervised and unsupervised model training, and automated pattern discovery from complex datasets.
### #Manufacturing Engineering
- URL: https://hackenberg.tech/tags/manufacturing-engineering/
- Description: Engineering methodologies and software systems for designing, operating, and optimizing modern manufacturing processes.
### #Manufacturing Systems
- URL: https://hackenberg.tech/tags/manufacturing-systems/
- Description: Integrated hardware, robotic workcells, control logic, and production planning frameworks for industrial discrete manufacturing.
### #Mastra
- URL: https://hackenberg.tech/tags/mastra/
- Description: TypeScript-natives Open-Source-Framework zur Entwicklung produktionsreifer KI-Agenten, deterministischer Workflows und nativer MCP-Integrationen.
### #Mathematical Optimization
- URL: https://hackenberg.tech/tags/optimization/
- Description: Linear, integer, and heuristic mathematical programming algorithms for finding optimal configurations under complex constraints.
### #Mechatronic Systems
- URL: https://hackenberg.tech/tags/mechatronic-systems/
- Description: Synergistic integration of mechanical engineering, electronics, computer science, and control theory in complex automated machinery.
### #Mem0 Architecture
- URL: https://hackenberg.tech/tags/mem0/
- Description: Persistent, adaptive long-term memory layer for AI agents and personalized language model interactions.
### #Mind Mapping & Visual Thinking
- URL: https://hackenberg.tech/tags/mind-mapping/
- Description: Radial graph structures and visual cognition tools for outlining ideas, planning projects, and structuring thought.
### #Mindful IT
- URL: https://hackenberg.tech/tags/mindful-it/
- Description: Thoughtful software engineering practices focusing on simplicity, deliberate user attention, and sustainable digital workflows.
### #Model Context Protocol (MCP)
- URL: https://hackenberg.tech/tags/mcp/
- Description: Offener Industriestandard zur standardisierten Bereitstellung von Werkzeugen, Datenquellen und Prompts für KI-Agenten und Entwicklungsumgebungen.
### #Motion Capture & Tracking
- URL: https://hackenberg.tech/tags/motion-capture/
- Description: Optical and inertial tracking pipelines capturing high-precision human movement for ergonomics and biomechanical analysis.
### #Neo4j Graph Database
- URL: https://hackenberg.tech/tags/neo4j/
- Description: High-performance native graph database designed for managing connected enterprise data and semantic knowledge graph traversals.
### #Open Source Software
- URL: https://hackenberg.tech/tags/open-source/
- Description: Publicly accessible software source code enabling transparent inspection, collaborative community contribution, and sovereign deployment.
### #Open WebUI
- URL: https://hackenberg.tech/tags/open-webui/
- Description: Open-source, self-hosted AI interface, human-in-the-loop workspace, and enterprise orchestration platform.
### #Presentations & Slides
- URL: https://hackenberg.tech/tags/slideshare-presentation/
- Description: Visual slide decks, conference presentations, and lecture summaries distributed across academic platforms.
### #Product Design & Engineering
- URL: https://hackenberg.tech/tags/product-design/
- Description: Iterative physical and digital product development, user ergonomics, and modular mechanical design.
### #Production Scheduling
- URL: https://hackenberg.tech/tags/scheduling/
- Description: Constraint satisfaction algorithms and timeline optimization for manufacturing dispatching and resource allocation.
### #Prompt Engineering
- URL: https://hackenberg.tech/tags/prompt-engineering/
- Description: Systematic prompt design, few-shot prompting, and structured context techniques to elicit reliable outputs from foundation models.
### #Psychology & Human Behavior
- URL: https://hackenberg.tech/tags/psychology/
- Description: Behavioral principles, habit formation, and motivational mechanics applied to technological systems.
### #Python Programming
- URL: https://hackenberg.tech/tags/python/
- Description: Scientific computing, data science libraries, automated scripting, and modern software development with Python.
### #React Ecosystem
- URL: https://hackenberg.tech/tags/react/
- Description: Component-driven front-end user interface architecture, declarative UI state, and reactive rendering pipelines.
### #Regional Development
- URL: https://hackenberg.tech/tags/regional-development/
- Description: Strategies and digital platforms aimed at strengthening local economic resilience, sustainability, and quality of life.
### #Retrieval-Augmented Generation (RAG)
- URL: https://hackenberg.tech/tags/rag/
- Description: Architectures combining vector databases, document chunking, and semantic search to ground language model responses in verified facts.
### #Search Engine Optimization (SEO)
- URL: https://hackenberg.tech/tags/seo/
- Description: Technical architecture, metadata hygiene, structured schema data, and crawlability optimization for web content.
### #Smart Home Automation
- URL: https://hackenberg.tech/tags/smart-home/
- Description: Decentralized home automation, sensor integration, and intelligent microclimate and energy management.
### #Smart Irrigation
- URL: https://hackenberg.tech/tags/irrigation/
- Description: Automated soil moisture tracking, weather-predictive valve control, and water-conserving agricultural systems.
### #Smart Workplace Systems
- URL: https://hackenberg.tech/tags/smart-workplace/
- Description: Ergonomic sensing, automated desk adjustments, and digital environmental controls optimizing knowledge worker health.
### #Social Media & Content Feeds
- URL: https://hackenberg.tech/tags/social-media/
- Description: Automated feed synchronization, social graph integration, and engagement telemetry across professional networks.
### #Software Architecture
- URL: https://hackenberg.tech/tags/software-architecture/
- Description: High-level design decisions, architectural patterns, separation of concerns, and structural excellence in complex software.
### #Software as a Service (SaaS)
- URL: https://hackenberg.tech/tags/saas/
- Description: Cloud-hosted multi-tenant web application architecture, recurring billing, and scalable subscription software delivery.
### #Software Engineering
- URL: https://hackenberg.tech/tags/software-engineering/
- Description: Principles, methodologies, design patterns, quality assurance, and lifecycle management for building robust software systems.
### #Software Systems
- URL: https://hackenberg.tech/tags/software-systems/
- Description: Large-scale, reliable, and maintainable software engineering solutions solving complex multi-component operational challenges.
### #State Management
- URL: https://hackenberg.tech/tags/state-management/
- Description: Patterns and libraries for managing predictable, deterministic application state across distributed user interfaces.
### #Sustainability & Green IT
- URL: https://hackenberg.tech/tags/sustainability/
- Description: Ecological computing practices, energy-efficient code execution, and software applications for environmental stewardship.
### #Systems Analysis
- URL: https://hackenberg.tech/tags/systems-analysis/
- Description: Systematic breakdown, requirements decomposition, and domain modeling of complex technological and organizational systems.
### #Systems Design
- URL: https://hackenberg.tech/tags/systems-design/
- Description: Synthesizing technical components, interfaces, and protocols to construct coherent, resilient engineering systems.
### #Systems Engineering
- URL: https://hackenberg.tech/tags/systems-engineering/
- Description: Interdisciplinary engineering discipline focusing on designing, validating, and managing complex systems over their entire lifecycles.
### #Systems Implementation
- URL: https://hackenberg.tech/tags/systems-implementation/
- Description: Realization, deployment, and practical commissioning of engineered software and hardware specifications.
### #Systems Validation
- URL: https://hackenberg.tech/tags/systems-validation/
- Description: Rigorous empirical confirmation that a built system meets its stakeholders' intended purpose and requirements in its target operational environment.
### #Systems Verification
- URL: https://hackenberg.tech/tags/systems-verification/
- Description: Formal, algorithmic, and testing methods verifying that system specifications have been faithfully implemented.
### #Task Management & Workflow
- URL: https://hackenberg.tech/tags/task-management/
- Description: Productivity workflows, hierarchical task decomposition, and software tools for tracking execution progress.
### #Technical Drawing
- URL: https://hackenberg.tech/tags/drawing/
- Description: Interactive HTML5 canvas tools, 2D vector geometry rendering, SVG pipelines, and diagrammatic modeling applications for technical engineering software.
### #Thermal Engineering & Building Physics
- URL: https://hackenberg.tech/tags/thermal-engineering/
- Description: Heat transfer calculations, thermodynamics, and energy balance simulation in residential and industrial structures.
### #Three.js
- URL: https://hackenberg.tech/tags/threejs/
- Description: JavaScript 3D graphics library utilizing WebGL and WebGPU for interactive browser-based 3D scene rendering.
### #Traffic Control Systems
- URL: https://hackenberg.tech/tags/traffic-control/
- Description: Real-time sensor networks, signal timing optimization, and automated guidance for vehicle flow and public transit.
### #Transportation Systems
- URL: https://hackenberg.tech/tags/transportation-systems/
- Description: Modeling, simulation, and optimization of multimodal transit systems, autonomous logistics networks, and intelligent urban mobility infrastructure in research and academia.
### #TypeScript
- URL: https://hackenberg.tech/tags/typescript/
- Description: Statically typed programming language extending JavaScript with type safety, compile-time validation, and tooling support.
### #User Experience (UX) Design
- URL: https://hackenberg.tech/tags/ux-design/
- Description: Holistic user journeys, usability testing, and interaction models prioritizing human satisfaction and task efficiency.
### #User Interface Design
- URL: https://hackenberg.tech/tags/user-interface/
- Description: Visual layout, component ergonomics, typography, and interactive aesthetics for computer software.
### #Video Lectures & Tutorials
- URL: https://hackenberg.tech/tags/youtube-video/
- Description: Educational video productions, coding demonstrations, and conference recording archives on YouTube.
### #Vis.js Network
- URL: https://hackenberg.tech/tags/visjs/
- Description: Dynamic browser visualization library specializing in interactive node-link network diagrams with physics simulation.
### #vLLM Inference Engine
- URL: https://hackenberg.tech/tags/vllm/
- Description: High-throughput and memory-efficient LLM serving engine featuring PagedAttention for production model inference.
### #Web Development
- URL: https://hackenberg.tech/tags/web-development/
- Description: Engineering standards, responsive design, and browser technologies for scalable internet applications.
### #Web Performance
- URL: https://hackenberg.tech/tags/performance/
- Description: Optimization strategies, Core Web Vitals, and architectural patterns for delivering blazingly fast digital experiences.
### #Web-LLM
- URL: https://hackenberg.tech/tags/web-llm/
- Description: In-browser machine learning execution running quantized large language models locally via WebGPU.
### #WebGL
- URL: https://hackenberg.tech/tags/webgl/
- Description: Cross-platform, royalty-free web standard for low-level 3D hardware-accelerated graphics in web browsers.
### #WebGPU
- URL: https://hackenberg.tech/tags/webgpu/
- Description: W3C standard for next-generation hardware-accelerated 3D graphics and compute shaders in web browsers, enabling high-performance client-side rendering and simulations.
### #WikiSkills Platform
- URL: https://hackenberg.tech/tags/wikiskills/
- Description: Collaborative knowledge base and competence management platform developed for structured enterprise skill sharing.
### #Zumida Platform
- URL: https://hackenberg.tech/tags/zumida/
- Description: Visual spatial collaboration canvas and diagramming workspace designed for agile development teams.
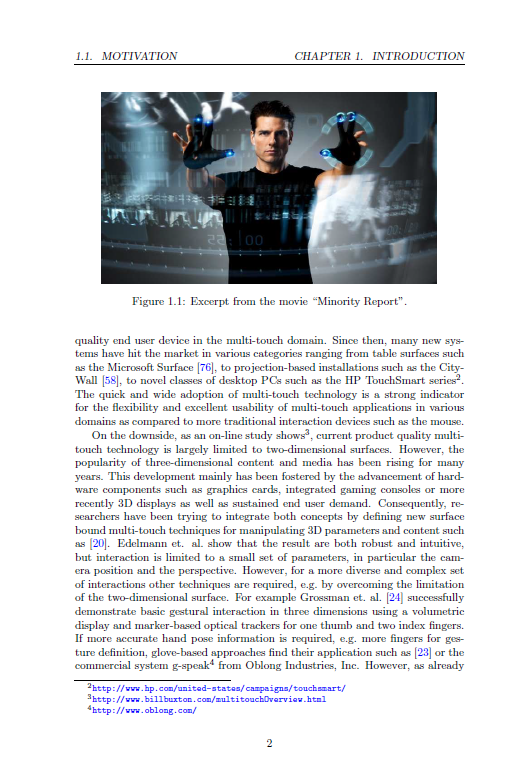
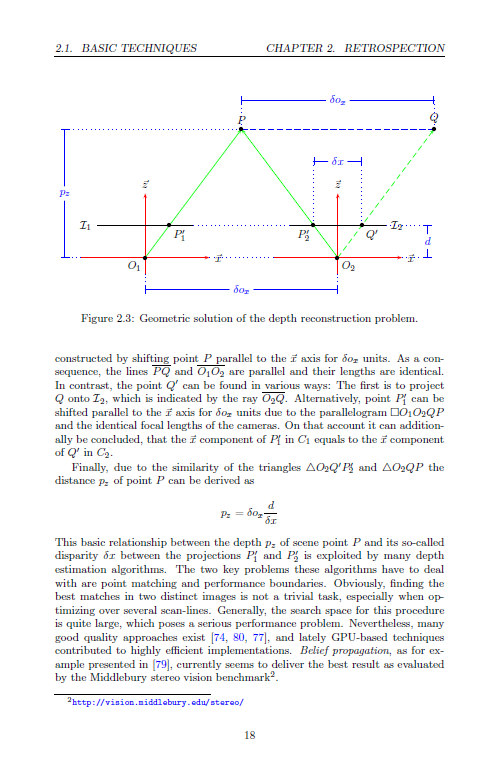
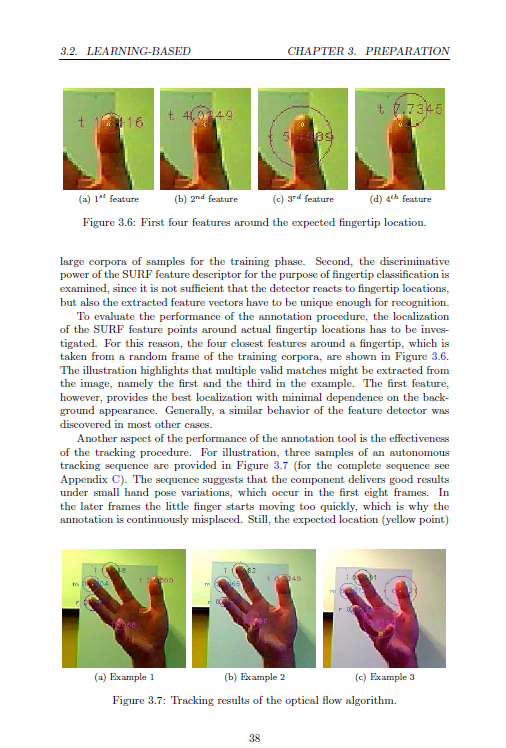
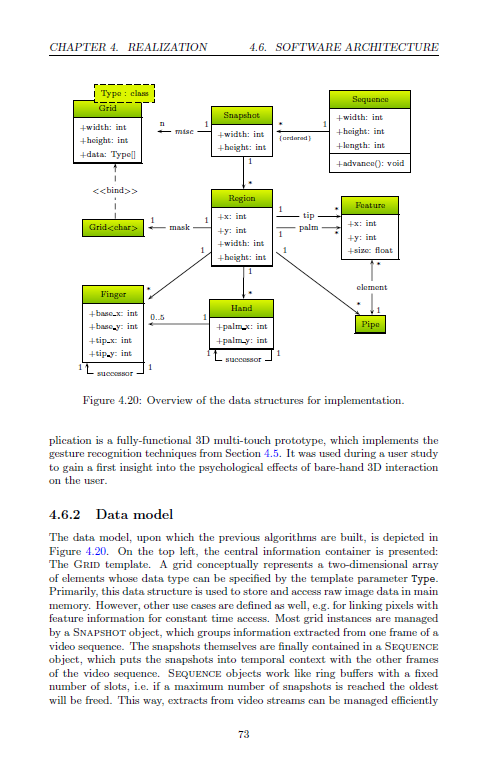

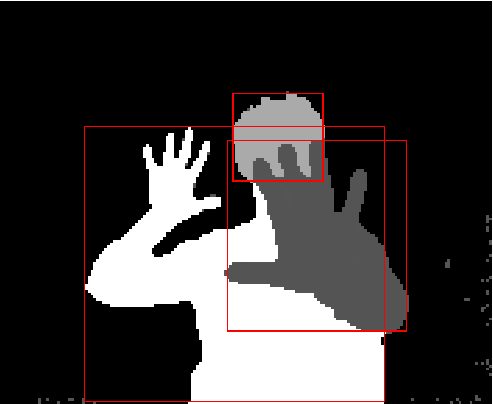



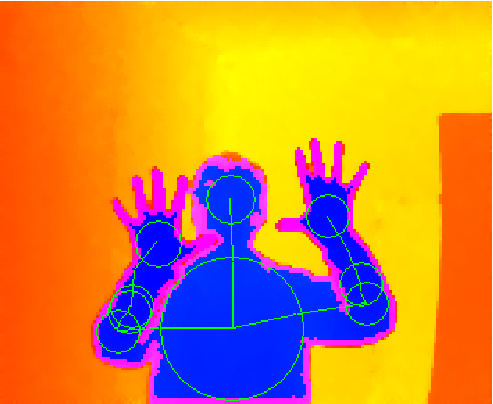
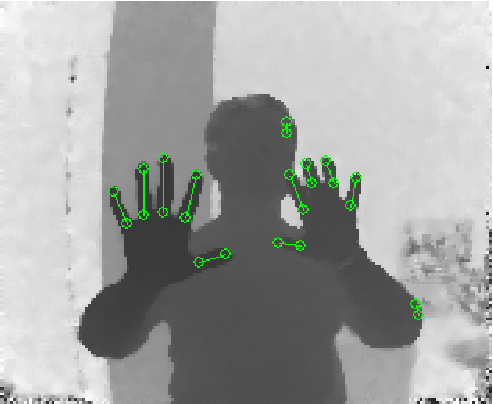
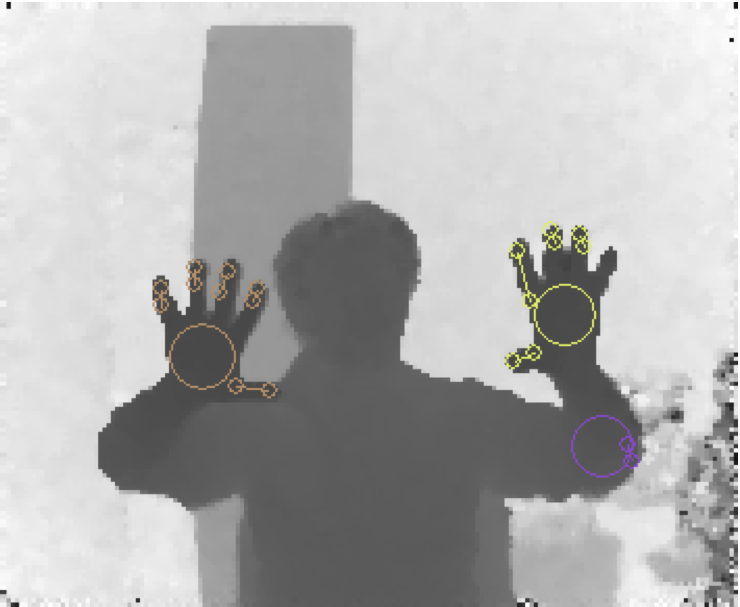
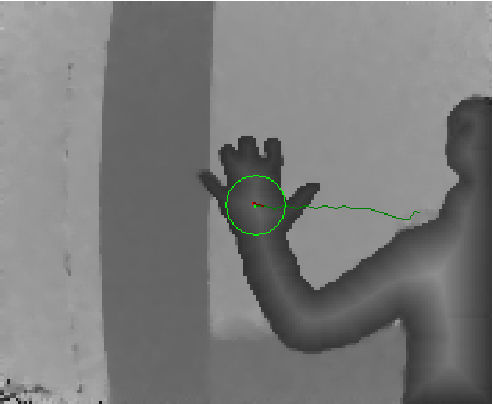
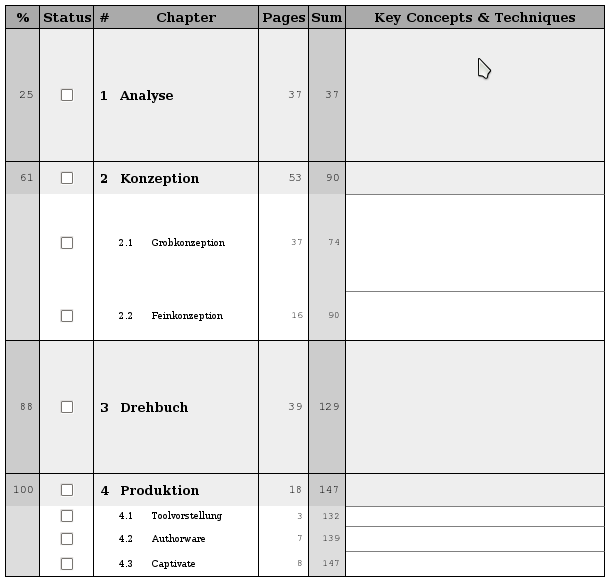 The basic idea is, to have a table of the chapters, which have to be studied, their size and the overall percentage of progress after finishing it.
In the picture to the right I have posted a schedule which I created for my *eLearning* exam last year.
For this exam I had to study the production process for eLearning material.
The production process is constituted of four main entities: the *analysis* where we have to find out what should be accomplished by introducing an eLearning system, the *conception* where we create an initial prototype for the system which can be verified by the customer, the *screenplay* which describes the eLearning system in its entire detail, and finally the *production* where the system is implemented for shipping.
The plan provides me with the information of *how many slides* I have to read for each chapter.
It also provides an accumulated view, i.e. the *sum over all preceeding chapters*.
From this information we can calculate the *progress precentages*.
The progress percentages help measuring and auditing your performance.
Therefore, we also have a *status checkbox* to store your current progress.
When finishing a chapter, I usually mark it as checked.
Additionally, I write down the *key concepts and techniques*.
They are meant to give a quick overview over the chapter's contents and guide you through the details.
The basic idea is, to have a table of the chapters, which have to be studied, their size and the overall percentage of progress after finishing it.
In the picture to the right I have posted a schedule which I created for my *eLearning* exam last year.
For this exam I had to study the production process for eLearning material.
The production process is constituted of four main entities: the *analysis* where we have to find out what should be accomplished by introducing an eLearning system, the *conception* where we create an initial prototype for the system which can be verified by the customer, the *screenplay* which describes the eLearning system in its entire detail, and finally the *production* where the system is implemented for shipping.
The plan provides me with the information of *how many slides* I have to read for each chapter.
It also provides an accumulated view, i.e. the *sum over all preceeding chapters*.
From this information we can calculate the *progress precentages*.
The progress percentages help measuring and auditing your performance.
Therefore, we also have a *status checkbox* to store your current progress.
When finishing a chapter, I usually mark it as checked.
Additionally, I write down the *key concepts and techniques*.
They are meant to give a quick overview over the chapter's contents and guide you through the details.
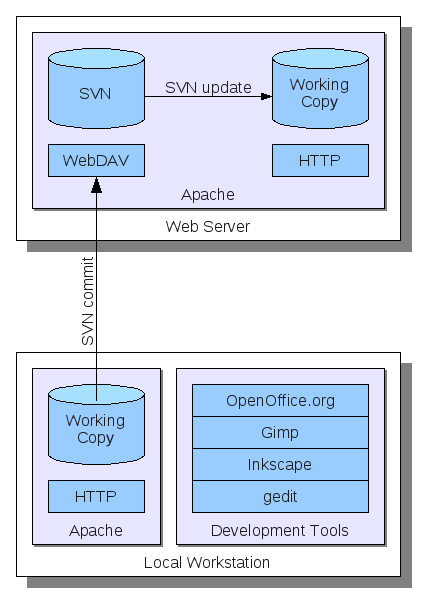 The general infrastructure of the online publication system is depicted in the figure to the right.
Most importantly, I have a *Subversion* repository installed on my *Apache* web server which is accessible via *WebDAV*.
This respository contains the entire website from the front page to all articles including the comments.
The general infrastructure of the online publication system is depicted in the figure to the right.
Most importantly, I have a *Subversion* repository installed on my *Apache* web server which is accessible via *WebDAV*.
This respository contains the entire website from the front page to all articles including the comments.