The semantics behind the graph visualization is as follows: Nodes represent system components and observations. Components have a link to their parent components (child components respectively). Observations have a link to their declaring component. Further edges show the influence relationship between components. Now try to make sense out of the following mess:
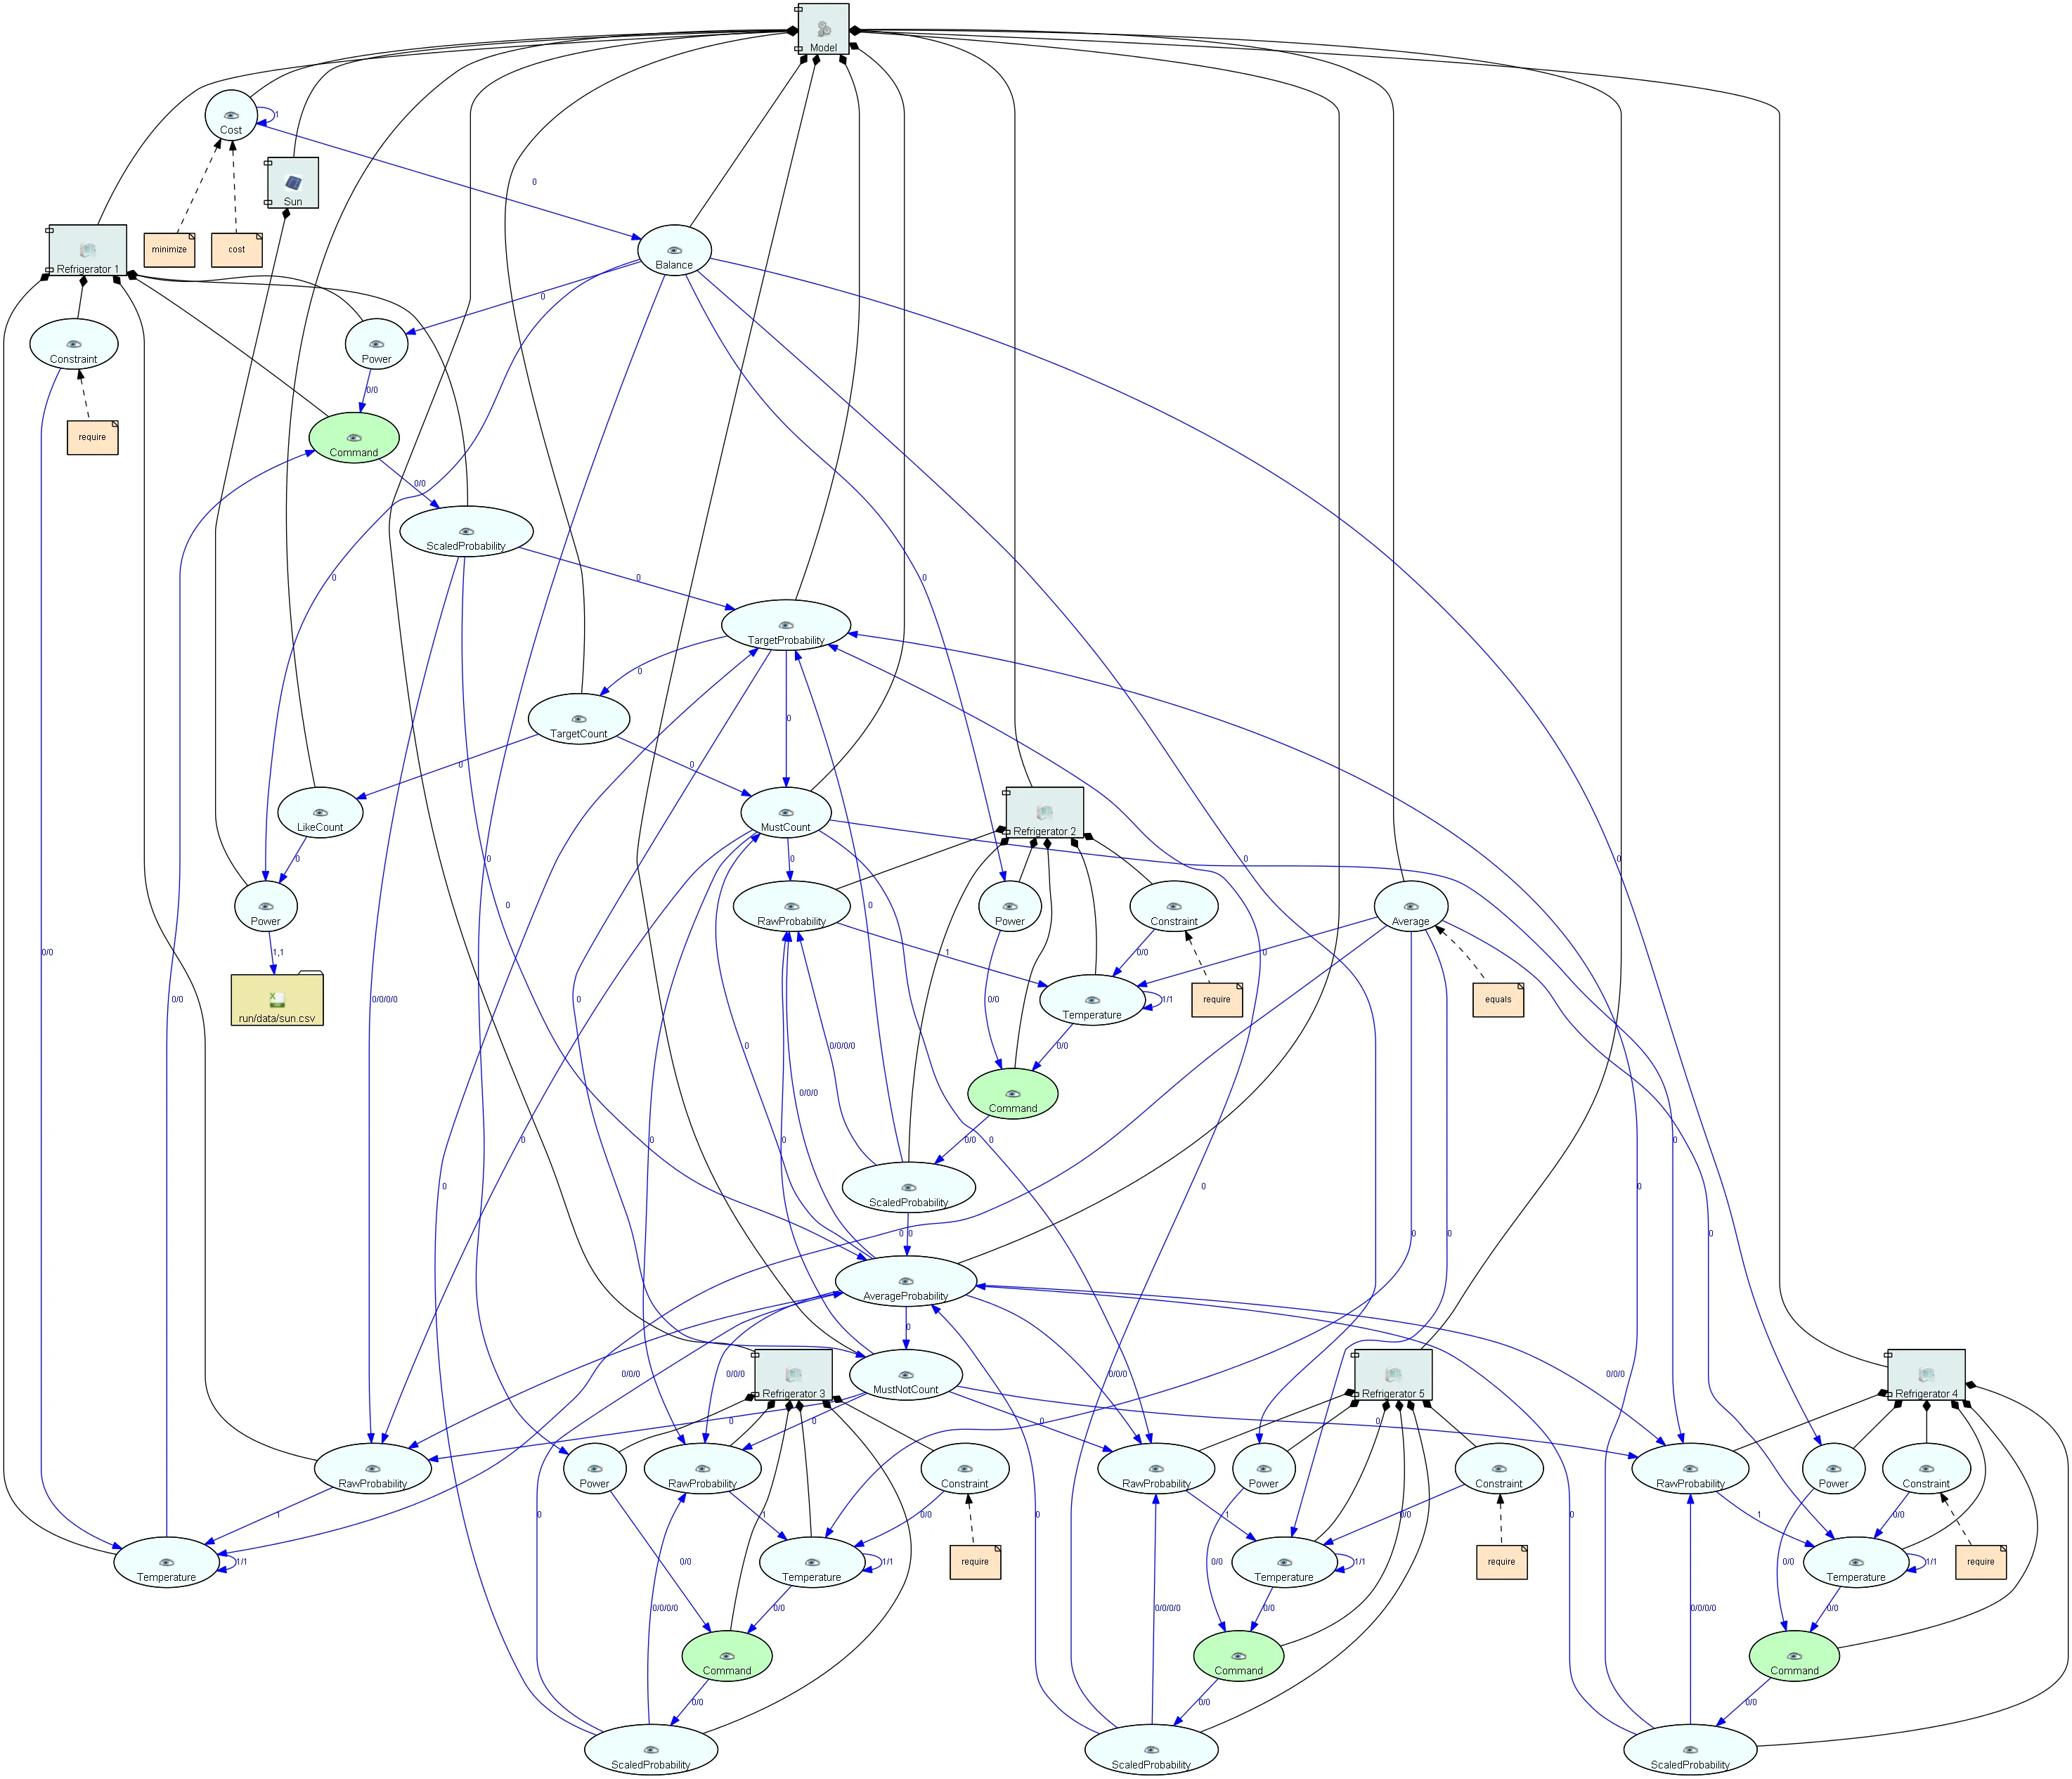
If you have questions do not hesitate to ask me! This is just early outcome from our simulation/exploration framework. We are working to make it better…