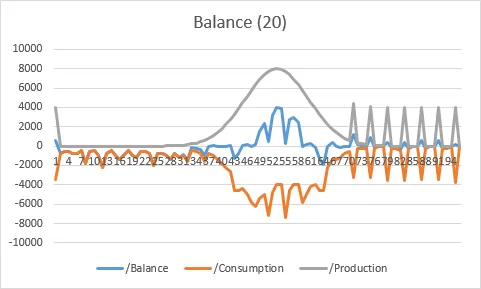
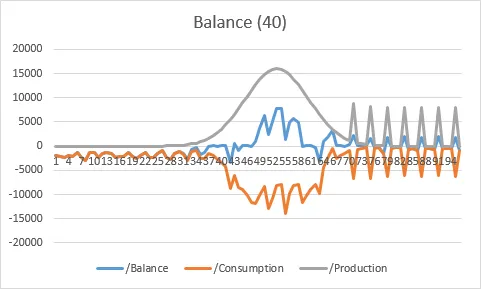
The first two diagrams show the energy balance obtained when coordinating up to 40 refrigerators with respect to solar energy and a single energy storage. It should be noted that the refrigerator and storage behavior is generated by our exploration tool.
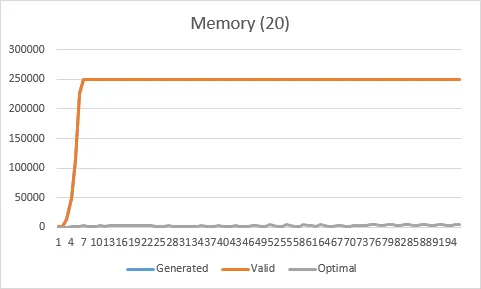
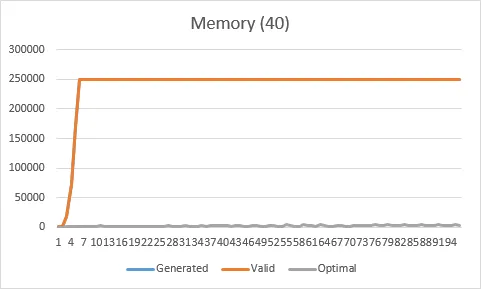
The following two diagrams illustrate the memory usage during exploration. The usage is given in terms of generated, valid and optimal behavior per time step. Interestingly, the memory usage does not change even though the problem size grows exponentially.
The final two diagrams depict the CPU time consumption for running the individual steps of the exploration algorithm. The time required approximately doubles due to double the number of state variables in the system model.
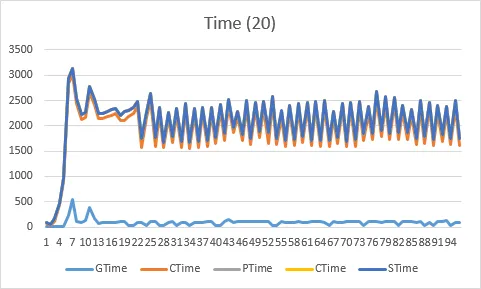
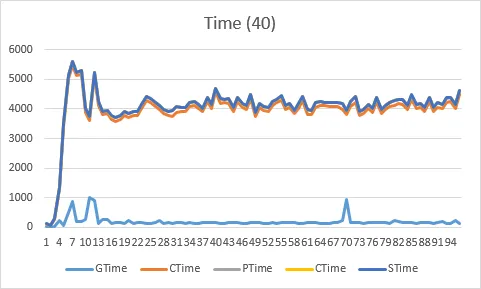
The key behind the results is guided behavior space exploration, i.e. the model is enriched with little extra information that can be used by the algorithm to generate better results. Now we are working on a technical demonstration of the presented technique.