Back to Tags

#Data Visualization

Visual encoding techniques, graphical displays, and interactive visual analytics for understanding complex datasets and processes.

✍️Blog Posts52

All Posts →
Dr. Georg Hackenberg analysiert vereinte Such- und Engagement-Metriken im Freien auf der Holzterrasse in Grünau im Almtal

Vom Konzept zum Agenten-Werkzeug: Wie unser Unified Analytics MCP Server Search Console und Plausible für datengestützte GEO/AIO-Audits vereint

Datengestützte Content-Optimierung im Zeitalter von KI-Suchmaschinen: Warum isolierte Web-Analytics versagen, wie unser nativer Model Context Protocol (MCP) Server Google Search Console und Plausible deterministisch zusammenführt, und wie Coding-Agenten Seiten vollautomatisch auditieren.

Dr. Georg Hackenberg am höhenverstellbaren Massivholz-Schreibtisch vor dem Ultrawide-Monitor mit Blick auf die Almtaler Berglandschaft

Zero-JS Mermaid in Astro: Warum wir Diagramme statisch vorrendern und wie Build-Time-SVGs für SEO, AIO und Core Web Vitals optimieren

Technische Schaubilder ohne Client-Overhead: Warum clientseitiges Mermaid das Web verlangsamt, wie unsere Build-Time-Pipeline mit Puppeteer und Astro Remark funktioniert, und wie maschinenlesbare Topologien modernen KI-Suchmaschinen (GEO/AIO) den Weg weisen.
🚀Software Projects2

All Projects →

Mentawise

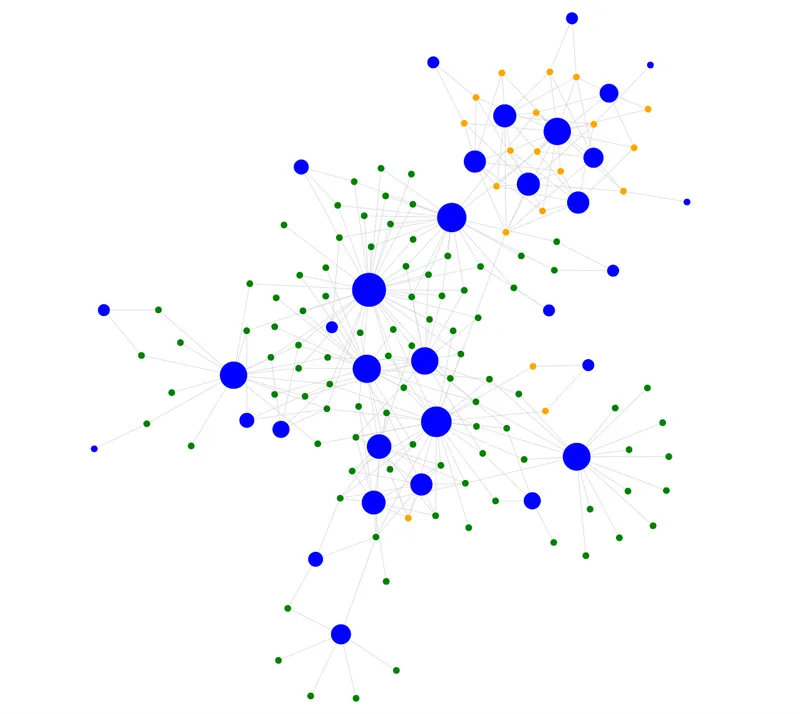
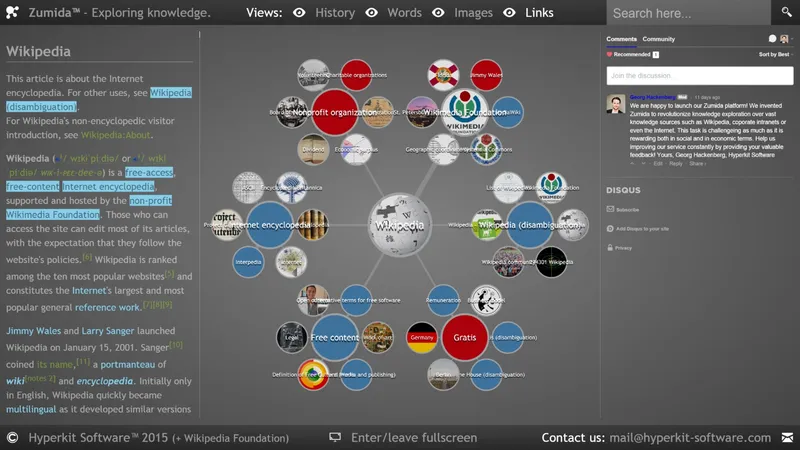
Knowledge Graph Visualizer

Mentawise is an innovative knowledge management solution letting visual thinkers quickly build personal knowledge graphs and share them instantly with others.

SpineML

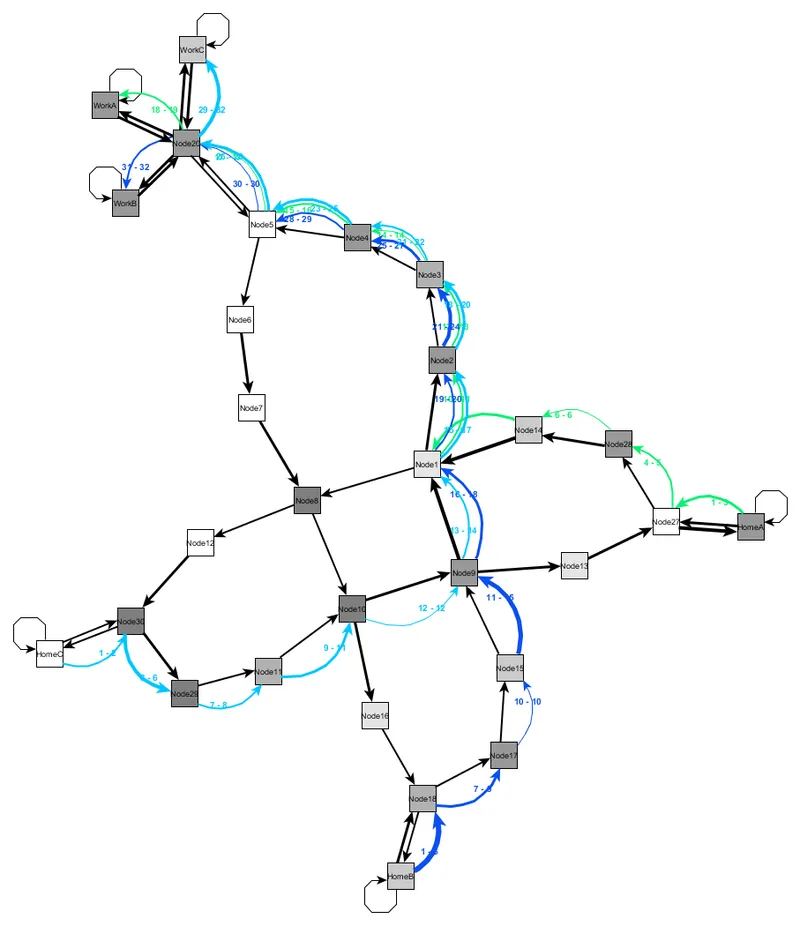
Layout & Simulation Toolkit

A Python toolkit designed to optimize factory layout planning (FLP) and job shop scheduling (JSS) through advanced layout modeling and simulation.
🌐Content Visualizations5

All Visualizations →

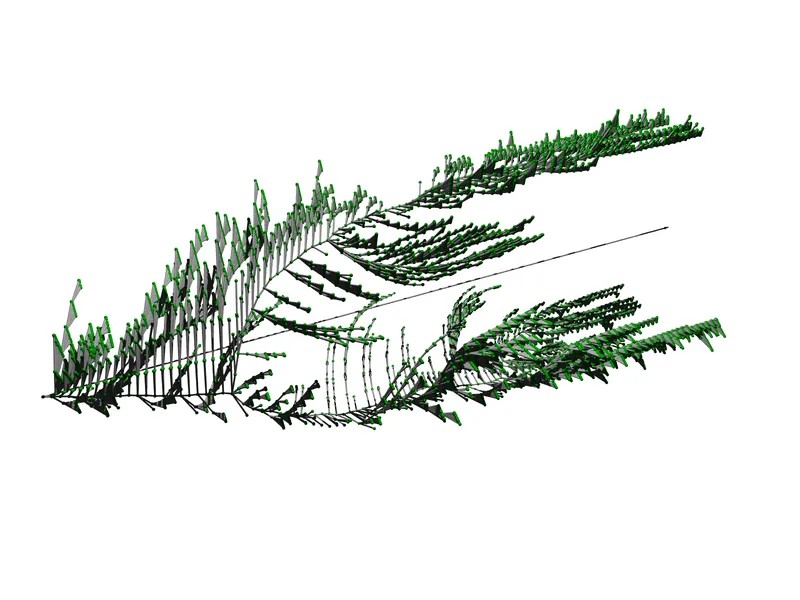
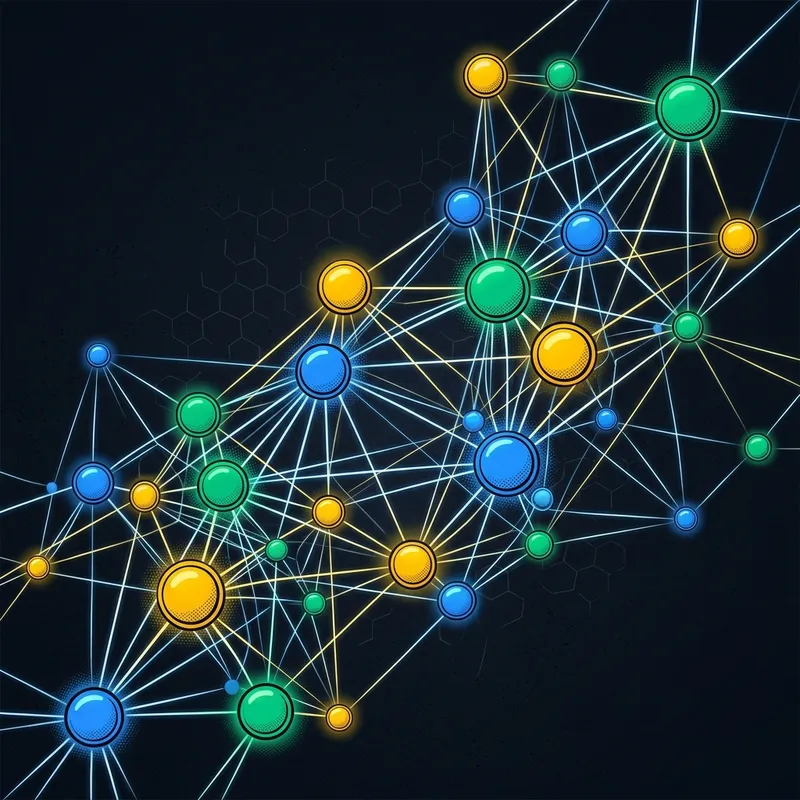
3D Force: Volumetric Network Graph

Interactive 3D network graph visualization in volumetric coordinates using WebGL and Three.js with orbital camera controls by Dr. Georg Hackenberg.
Cytoscape.js: Semantic Network Graph

Interactive graph theory analysis and force-directed network layouts in the browser using Cytoscape.js and CoSE physics by Dr. Georg Hackenberg.

D3.js: Force-Directed Network Graph

Physics-based force simulation and interactive SVG vector network graph layout using D3.js with velocity Verlet integration by Dr. Georg Hackenberg.

Sigma.js: ForceAtlas2 Network Graph

Interactive WebGL network graph visualization using Sigma.js and multi-threaded ForceAtlas2 physics in web workers by Dr. Georg Hackenberg.

Vis.js: Physics-Based Network Graph

Interactive 2D network graph visualization using Vis.js with physics simulation and dynamic particle interactions by Dr. Georg Hackenberg.