Welding Analytics
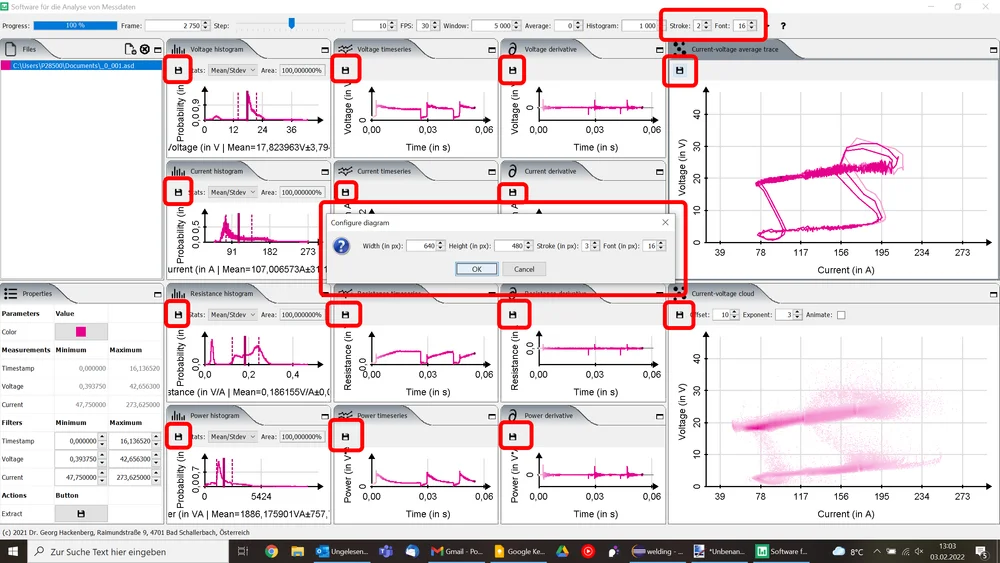
High-performance industrial analytics and visualization suite for high-frequency welding process data, featuring custom timeseries rendering, arc cyclograms, and density distributions.
Technology Readiness Level
Technology Demonstrated in Relevant Environment
A fully functional representative engineering prototype or pilot architecture is demonstrated in an operational or high-fidelity relevant environment, demonstrating critical functions across realistic constraints.
Framework alignment: Standardized 9-level TRL (NASA / EU Horizon Europe).
Core Challenge
Modern industrial arc welding processes produce high-frequency electrical sensor streams at tens of kilohertz. Generic spreadsheet software and standard charting libraries choke on multi-million-point timeseries, while commercial proprietary analysis suites lack flexibility for custom mathematical transformations, rate-of-change derivatives, and phase-space cyclograms.
System Architecture
A lightweight, standalone Java Swing desktop application engineered with custom 2D graphics rendering engines (avoiding heavy charting frameworks), an asynchronous event bus architecture, multi-format ingestion (HDF5 and ASD), and dockable multi-view workspaces for synchronous waveform, histogram, and U-I phase-space analytics.
Key Capabilities
- Zero-Overhead Custom Charting: Custom Java2D rendering pipeline bypassing heavy third-party charting libraries to guarantee fluid panning, zooming, and point-cloud rendering across millions of samples.
- Multi-Format Industrial Ingestion: Native parsing of industrial ASCII measurement logs (ASD) and hierarchical high-throughput HDF5 containers via jHDF.
- Synchronized Multi-Channel Waveforms: Coordinated timeline exploration of instantaneous voltage V(t), current I(t), dynamic resistance R(t) = V/I, and electrical power P(t) = V·I.
- Arc Phase & Cyclogram Analysis: Dynamic U-I scatter point clouds, trajectory traces, and real-time least-squares regression lines to characterize welding arc stability and droplet transfer regimes.
- Probability Density & Derivatives: Configurable statistical distribution histograms and numerical derivative curves (dV/dt, dI/dt) to detect micro-transients, spatter events, and short circuits.
- Flexible Dockable Workspace: Modular Swing docking environment allowing engineers to arrange, tear off, and configure custom analytics layouts suited to their diagnostic workflow.
Technology Stack
- Core Platform & UI Architecture: Java 23, Swing Desktop GUI, Docking Frames Core, Decoupled Event Bus Pattern
- Industrial Data Ingestion & Formats: jHDF (HDF5 Library), ASD Tabular Formats, JSON Configuration
- Analytical & Visualization Methods: Custom Java2D Vector Rendering, Dynamic U-I Phase Cyclograms, Probability Density Functions (PDF), Least-Squares Linear Regression, Numerical Time Differentiation
Verifiable Outcomes
- Packaged as a self-contained portable Windows desktop application with embedded Launch4j executable wrapper and JRE runtime.
- Zero-dependency custom 2D canvas architecture enabling real-time navigation across high-frequency industrial welding recordings.
- Open-source codebase on GitHub (github.com/ghackenberg/welding-analytics) under active engineering maintenance.