•11 min read
Interactive Graph Visualizations in JavaScript: WebGL, Cytoscape & 3D Compared
Compare WebGL, Three.js, Cytoscape.js, and Vis.js for interactive network graph visualizations in JavaScript. Benchmark performance and layouts.
Graph analysis and network visualization library for complex relationship mapping and computational biology.
Compare WebGL, Three.js, Cytoscape.js, and Vis.js for interactive network graph visualizations in JavaScript. Benchmark performance and layouts.
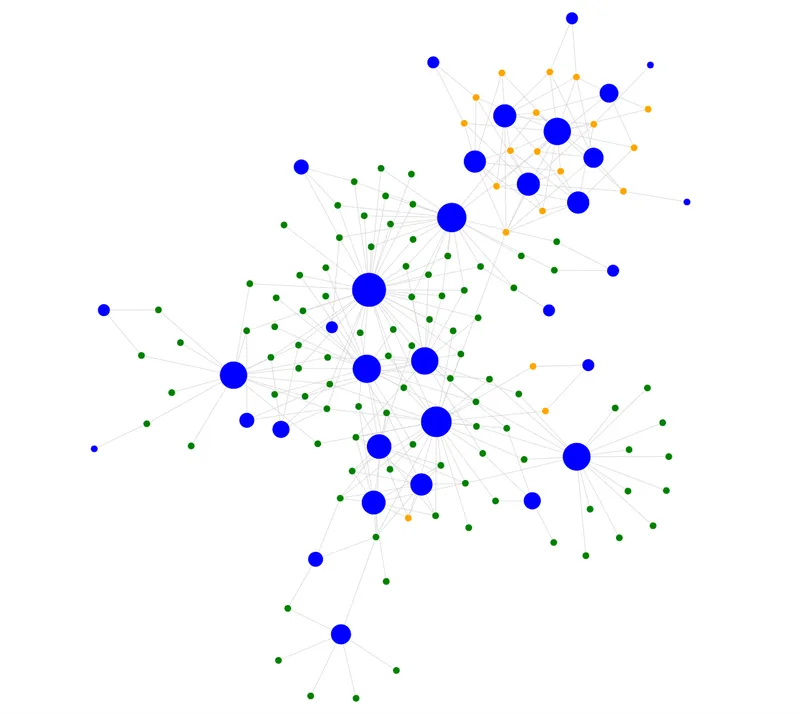
Recently, I added tags to my blog posts and scientific publications. The tags allow me to connect my articles based on keywords and topics. I use the tags to im...