
•11 min read
Interactive Graph Visualizations in JavaScript: WebGL, Cytoscape & 3D Compared
Compare WebGL, Three.js, Cytoscape.js, and Vis.js for interactive network graph visualizations in JavaScript. Benchmark performance and layouts.
Data-driven document manipulation and custom SVG/HTML rendering for rich interactive data visualizations.
Compare WebGL, Three.js, Cytoscape.js, and Vis.js for interactive network graph visualizations in JavaScript. Benchmark performance and layouts.
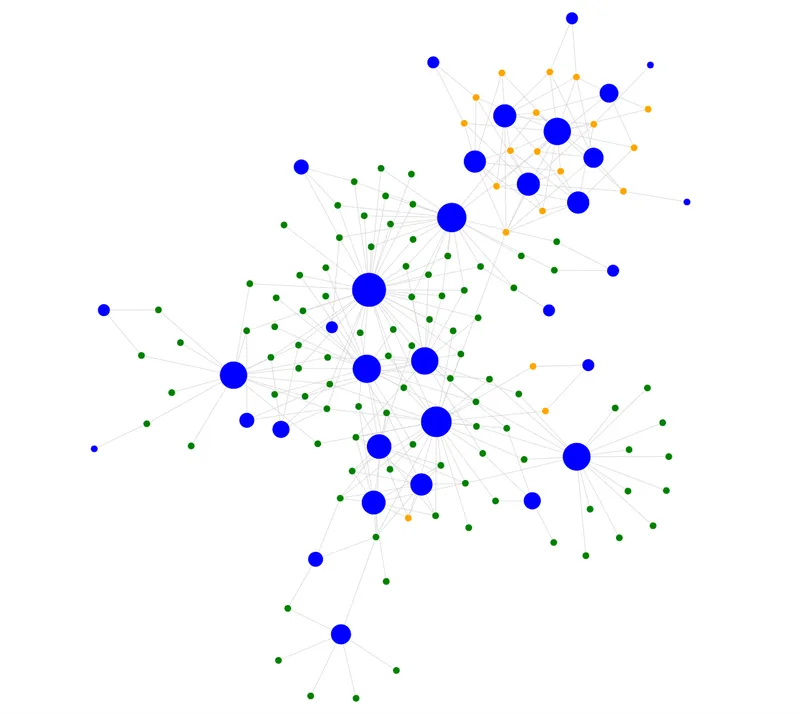
Recently, I added tags to my blog posts and scientific publications. The tags allow me to connect my articles based on keywords and topics. I use the tags to im...