In the example the control of 20 refrigerators and one energy storage is explored with respect to temperature band constraints and autonomy objectives. The visualization shows the traces explored, while some traces are omitted due to memory/time limitations and others are pruned due to dominance.
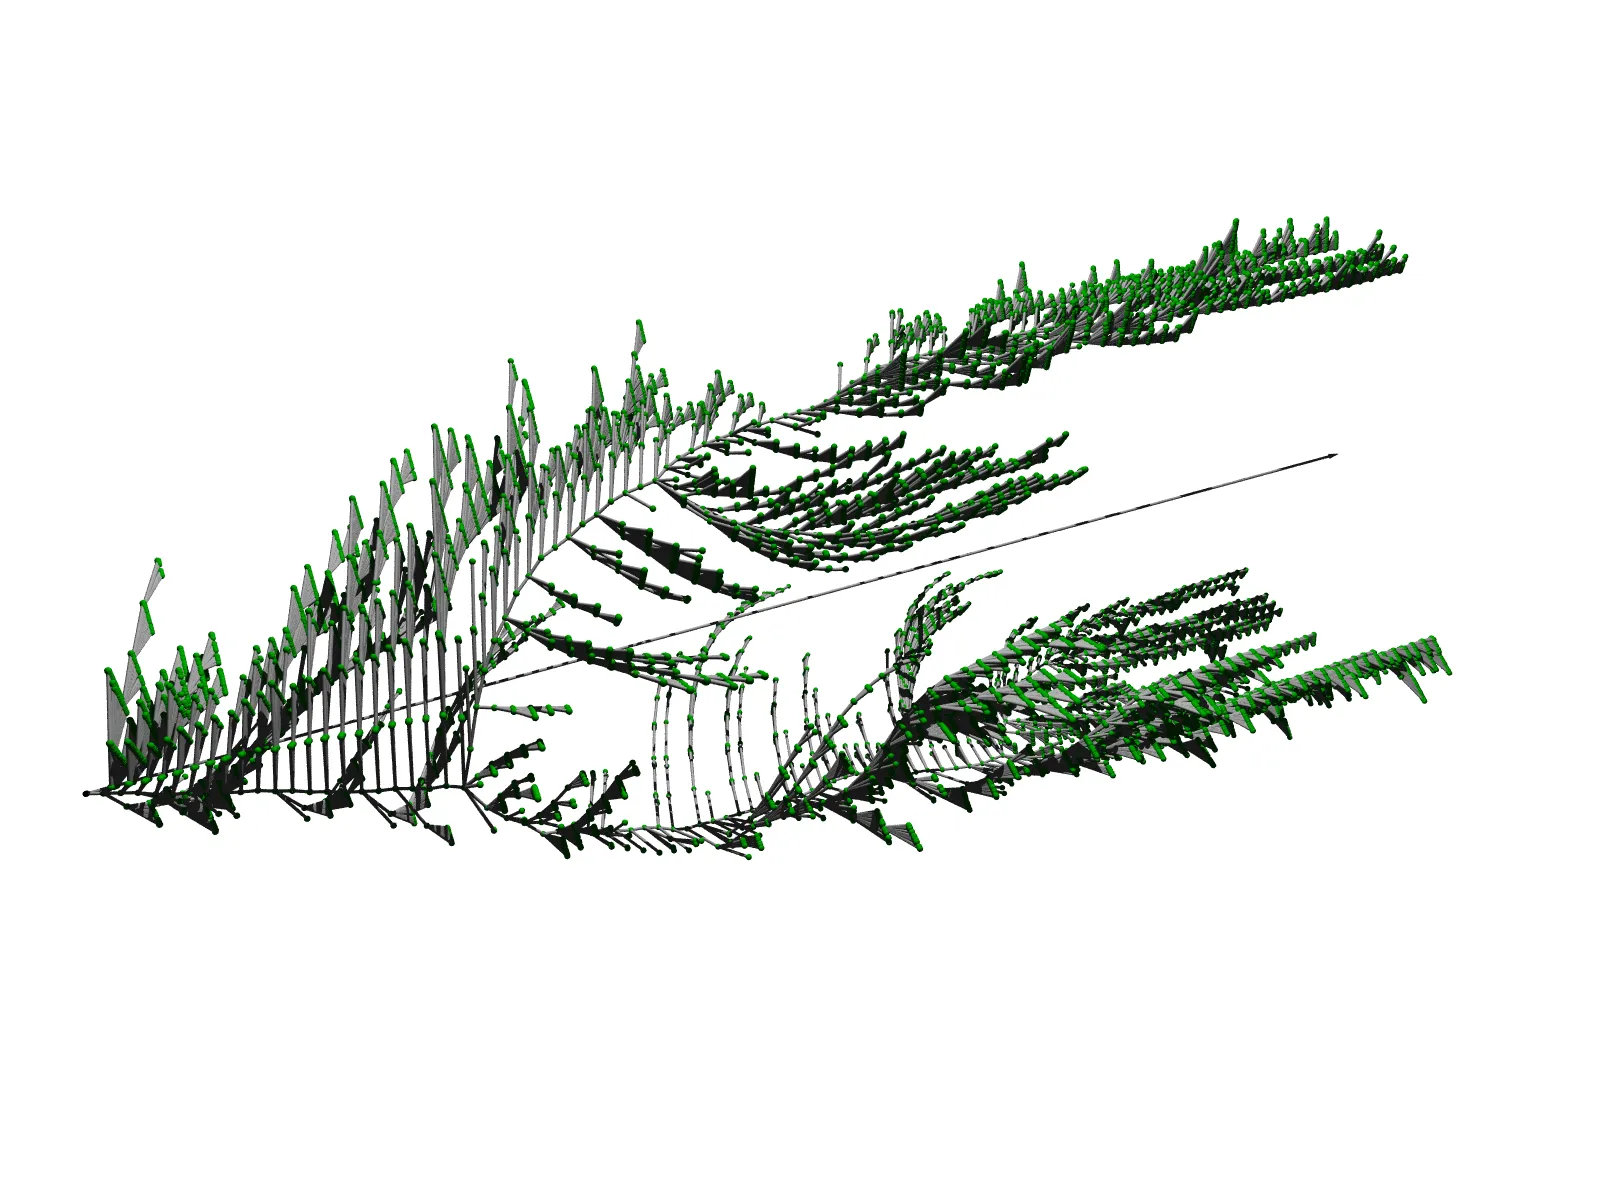
Currently we are working on improving the visualization to get a better picture of the axes and their meaning as well as the behavior exhibited within the individual traces.